
When I was a kid, I use to love “Paint by the Numbers” sets. Makes anyone who can paint or color between the lines a Rembrandt or Leonardo da Vinci (we can talk later about the long-term impact of forcing kids to “stay between the lines”).
 Well, the design world is applying the “Paint by the Numbers” concept using design canvases. A design canvas outlines what’s important given the subject area, and then allows the “painter” to color in the right information. A design canvas is a one-page operational template that is designed to capture all of the different perspectives necessary for successful execution depending upon the problem being solved. A great example of a canvas is the Business Model Canvas courtesy of Strategyzer (see Figure 1).
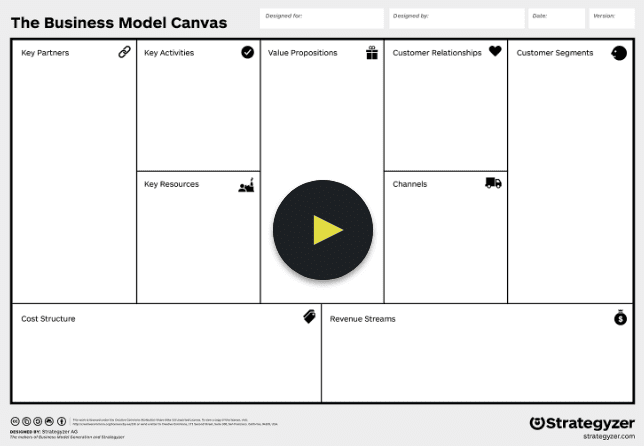
Figure 1: Business Model Canvas courtesy of Strategyzer
The Business Model Canvas forces organizations to “paint in” your business’s value proposition, cost structures, revenue streams, supplier network and customer segments. Overnight, everyone can become Jack Welch!
Now you are ready to take the next step from a Big Data MBA perspective by building off of the Business Model Canvas to flesh out the business use cases – or hypothesis – which is where we can become more effective at leveraging data and analytics to optimize our the business. That next step involves the newly created Hypothesis Development canvas.
Introducing Data Science Paint by the Numbers
The one area of under-invested in most data science projects is the thorough and comprehensive development of the hypothesis or use case that is being tested; that is, what it is we are trying to prove out with our data science engagement and how do we measure progress and success.
To address these requirements, we developed the Hypothesis Development Canvas – a “paint by the numbers” template that we will populate prior to executing a data science engagement to ensure that we thoroughly understand what we are trying to accomplish, the business value, how we are going to measure progress and success, what are the impediments and potential risks associated with the hypothesis. The Hypothesis Development Canvas is designed to facilitate the business stakeholder-data science collaboration (see Figure 2).
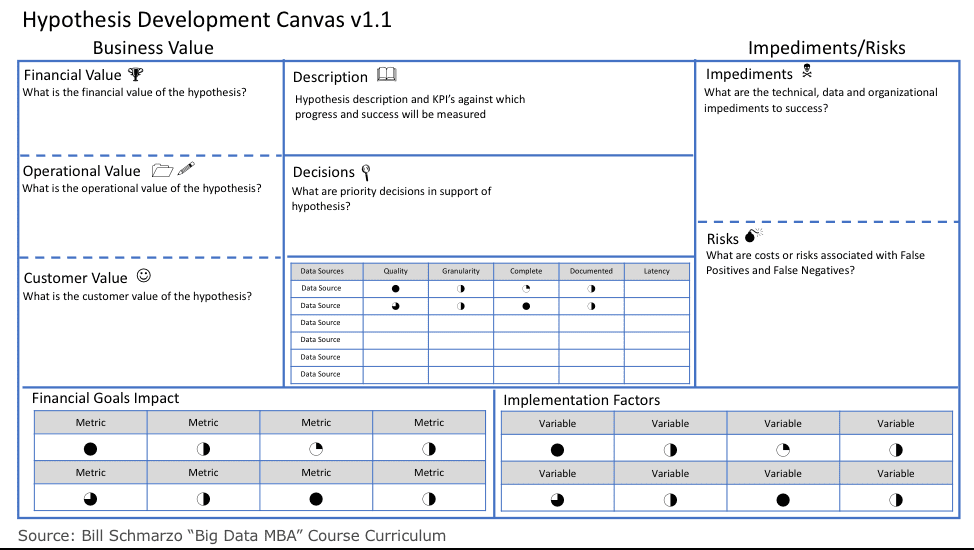
Figure 2: Hypothesis Development Canvas
The Hypotheses Development Canvas includes the following:
- Hypotheses Description and Objectives – what it is the organization is trying to predict and its associated goals (e.g., reduce unplanned operational downtime by X%, improve customer retention by X%, reduce obsolete and excessive inventory by X%, improve on-time delivery by X%).
- Hypothesis Business Value from the Financial, Customer and Operational perspectives; that is, what is the rough order Return on Investment (ROI) from successfully addressing the hypothesis.
- KPI’s against which to measure success and progress, and the exploration of the risks associated with potential 2ndand 3rdorder ramifications of KPI’s. See the blog “Unintended Consequences of the Wrong Measures” for more details on 2ndand 3rdorder ramifications of KPI’s.
- Decisions – the what, when, where, who, etc. – that needs to be made to support and drive actions and automation in support of the hypothesis’s business, customer and operational objectives.
- Potential data sources to explore including a brief description and why the business stakeholders feel that might be an appropriate data source to explore.
- Risks associated with False Positives and False Negatives (Type I and Type II Errors); the risks associated with those scenarios where the analytic model is wrong.
A Vision Workshop accelerates the collaboration between the business stakeholder and the data science team to identify the hypothesis requirements that underpin data science engagement success.
The Machine Learning Canvas (Big Data MBA Version)
Now to complete the loop, I introduce the Machine Learning Canvas. I stumbled upon the Machine Learning Canvas v0.4 from Louis Dorard at the web site “Machine Learning Canvas.” Louis has made his canvas freely available, and I will do likewise with the additions that we made to his canvas based upon our unique data science requirements (see Figure 3).
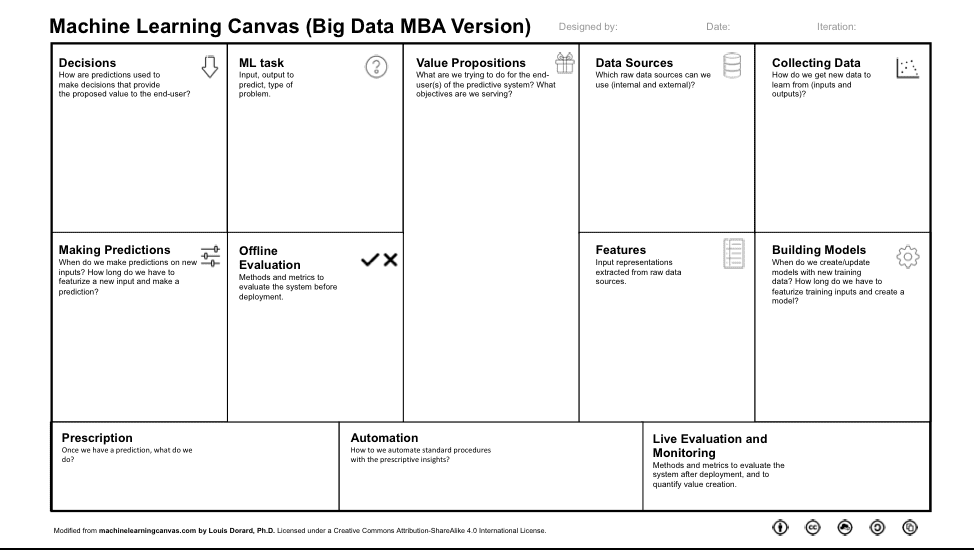
Figure 3: Machine Learning Canvas (Big Data MBA Version)
For purposes of our data science work, we needed to add to panels:
- Prescription: Once we have a prediction, what do we do with that prediction?
- Automation: How to we automate standard procedures with the prescriptive insights?
Summary
A successful data science engagement requires close collaboration with the business stakeholders throughout the development process to:
- Understand and quantify the sources of financial, operational and customer value creation (it’s an economics thing).
- Gain a thorough understanding of the KPI’s and metrics against which we are going to measure progress and success, and in particular, the potential second and third order ramifications of those KPI’s and metrics.
- Brainstorm the variables and metrics (data sources) that might yield better predictors of business and operational performance.
- Codify the rewards/benefits and the costs/risks associated with the hypothesis (including the risks and costs associated False Positives and False Negatives).
- Close collaborate with the Business Stakeholders to understand when “good enough” is actually “good enough” from a predictive analytics perspective.
We now have the three design canvases that allow us to not only link our business model to the data science and machine learning efforts, but the data science team can now have a direct “line of sight” from how their work impacts the business models.
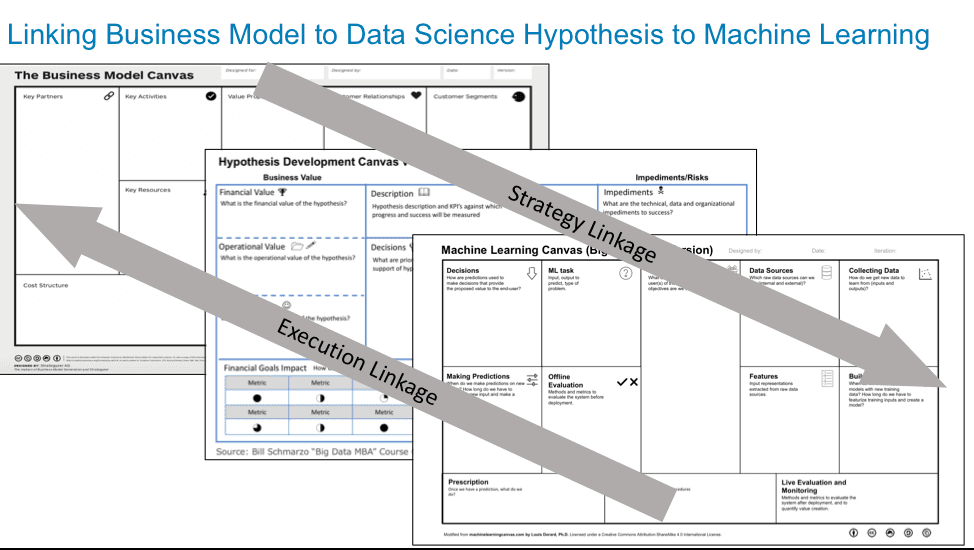
Figure 4: Linking Business Model to Data Science to Machine Learning
So to quote the famous American philosopher and part-time groundskeeper Carl Spackler, “Now I’ve got that goin’ for me, which is nice.”