

We are already seeing a handful of organizations who are actively exploiting the unique economic characteristics of data and analytics – digital assets that not only can be used across an unlimited number of use cases at zero marginal cost, but can also continuously-learn, adapt, and refine to become more valuable the more that they are used. And there is no better a place to identify those companies who are mastering the economics of data and analytics than in the wide discrepancy of tangible versus intangible assets of the world’s most valuable companies (Figure 1).
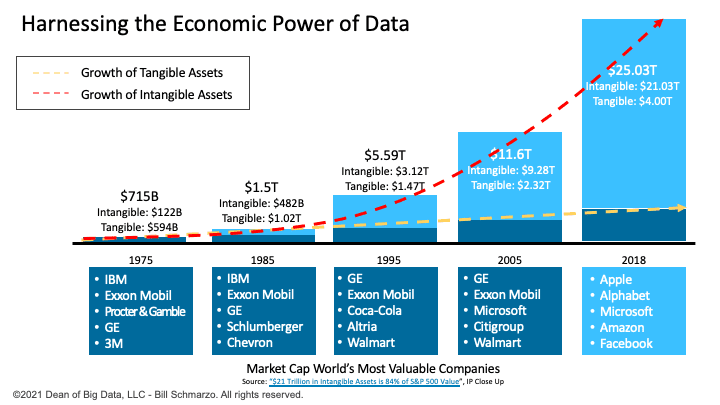
Figure 1: Market Leaders Who are Exploiting the Economics of Data and Analytics
What comprises intangible assets?
An intangible asset is an asset that is not physical in nature. Examples of intangible assets include branding, patents, trademarks, and copyrights.
While I can’t speak to the digital asset valuation of branding, patents, trademarks, and copyrights (sounds like opportunities for marketing and lawyer speak to me), I can speak to the digital asset valuation of data and analytics (see “The Economics of Data, Analytics, and Digital Transformation”).
The value of intangible assets is exploding driven by rapid exploitation of individualized analytic insights, or predictive behavioral and performance propensities, that leverage nanoeconomics to drive new sources of customer, product, service, and operational value (Figure 2).
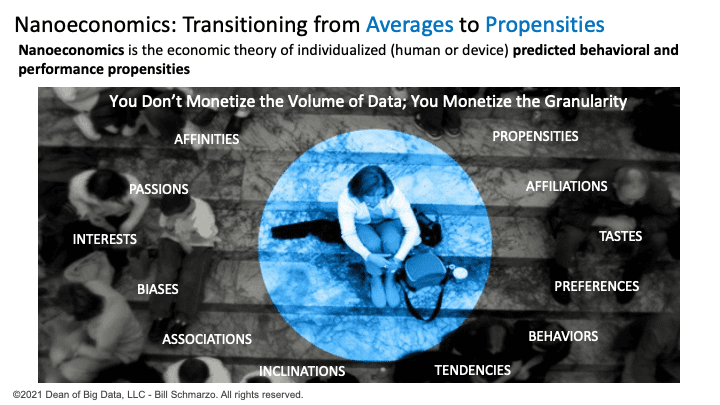
Figure 2: Nanoeconomics is the Economic Theory of Individual Predicted Propensities
So, here’s the opportunity (and an exercise for my students):
What opportunities can we envision that can directly increase the value of our intangible assets through the discovery and application of customer, product, service, and operational insights to drive quantifiable financial, customer, ecosystem, societal, and environmental value (Figure 3)?
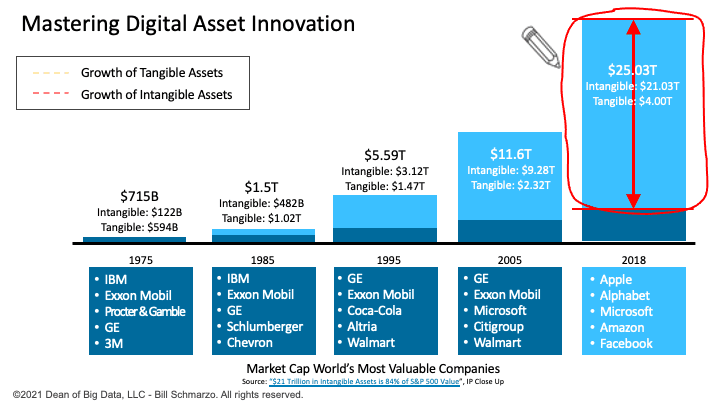
Figure 3: Mastering Digital Asset Innovation
Even if you are not a public company, every company needs to master the application of their data and analytic digital assets that drives creativity and business innovation. Cirque du Soleil CEO Daniel Lamarre in the BusinessWeek article “How Creativity Turned Cirque du Soleil Into an International Success” laid down the creativity and business innovation challenge:
“Whether you are an executive, an entrepreneur, or a professional, if you aren’t placing a high premium on creativity, you’re wasting your time. No company deserves to exist unless it’s constantly discovering ways to make its customers’ lives better. Simply put, without creativity, there is no business.”
Well, we can’t improve what we can’t measure. So, we need to create a measure against which organizations can measure their effectiveness in exploiting the economics of data and analytics to power their creativity and business innovation effectiveness. Let me introduce the Digital Innovation Index.
Defining the Digital Innovation Index
I’m going to propose a simple metric or index to help organizations understand how effective they are at leveraging data and analytics to drive innovation – the Digital Innovation Index. The Digital Innovation Index is calculated by dividing an organization’s Intangible Assets by its Tangible Assets then multiplied by 100 (Figure 4).
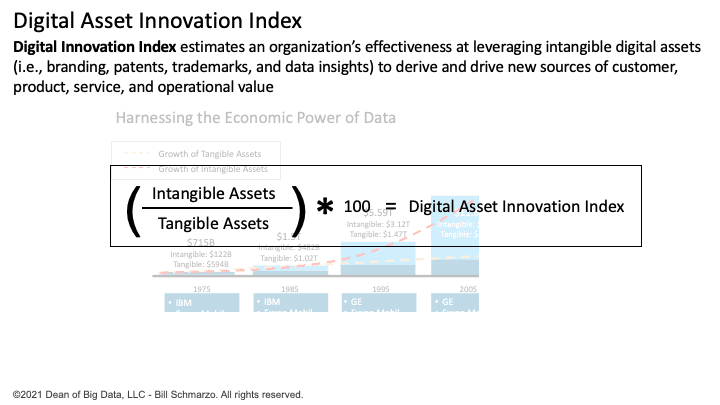
Figure 4: Digital Innovation Index
Going back to Figure 1, we can see that the top 5 most valuable companies in 2018 had an aggregated Digital Innovation Index of 525. In fact, tracking the Digital Innovation Index over the Figure 1 time periods, we can see the rapid growth of the Digital Innovation Index:
- 1975 = 20
- 1985 = 47
- 1995 = 212
- 2005 = 400
- 2018 = 525
Note: I know that the Digital Innovation Index is overly simplified, but it provides a frame against which organizations can start to measure the effectiveness of their data and analytics business innovation. I’m eager to see your suggestions and modifications in how we can improve the Digital Innovation Index calculation.
Digital Asset Innovation Exercise
Let’s introduce a simple exercise to get your business leadership to envision where and how they can innovate with data and analytics to increase the value of their intangible assets (and increase their Digital Asset Innovation score).
With the goal of creating a simple framework (that others can hopefully embellish), Figure 5 provides a simple envisioning exercise that you can perform (or you can hire me) with your senior business leadership. The goal of the exercise is to identify what business or operational actions you would take if you knew the predicted behavior or performance insights or propensities of your customers, products, services, and operations (Figure 5)?
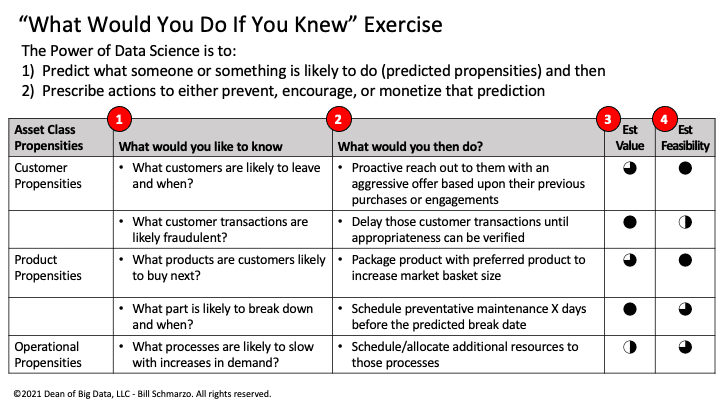
Figure 5: “What Would You Do If You Knew” Exercise
Here’s the exercise in a nutshell:
- Step 1: Brainstorm, validate, and prioritize in an envisioning workshop what predictive insights you would like to have about your Customers, Products, Services, and Operations. That is, what is it you would love to know about the predicted behavioral or performance propensities of your Customers, Products, Services, and Operations? Yea, lots of post-it notes and many chai tea lattes. Note: one could easily expand Step 1 to include additional asset classes such as Employees, Channels, Suppliers, Environmental, and Societal.
- Step 2: Given that you had knowledge of certain Customers, Products, Services, and Operations predicted behavioral and performance propensities, what actions would you take to capitalize on those knows propensities? For example, if you knew which customers were likely to attrite over the next 3 months, what preventative actions would you take to prevent those customers from leaving?
- Step 3: Create a rough order estimate of the “value” of those actions. You can leverage Value Engineering “Think Like a Data Scientist” methodology later in the process, but for now, just gather rough estimates from the workshop participants on a scale of 0 to 4 (perfect for a Harvey Balls assessment).
- Step 4: Rank (and be sure to document) the impediments for each action on a scale of 0 to 4 (where 4 is very easy and 0 is very hard). Again, perfect for Harvey Ball assessment.
The Hypothesis Development Canvas that is an output from the “Thinking Like a Data Scientist” process is a useful design tool in capturing the data and analytic requirements that support the potential actions identified in exercise (Figure 6).
Figure 6: Hypothesis Development Canvas
Data & Analytics Innovation Index Summary
The modern organization is leveraging data and analytics to create new customer, product, service, and operational insights that increase the value of the organization’s intangible assets and maximizes their Digital Innovation score.
The goal of this blog was to provide a simple envisioning exercise for business management to envision where and how to leverage data and analytics to directly increase the value of their intangible assets through the discovery and application of customer, product, service, and operational insights to drive quantifiable financial, customer, ecosystem, societal, and environmental value.
Oh, and maybe one more exercise: what would be the market cap value of your organization if you could increase the value of your intangible assets to 525% of your tangible assets? That’s a stock price that I think everyone could appreciate.