
Introduction to 5-part practical guide on becoming a data scientist.
Are you someone who:
- Has studied concepts of statistics, econometrics or mathematics?
- Loves reasoning, creating wild hypothesis and findings flaws in your concepts or theories?
- Planning to start a career in data science* or looking for ways to accelerate your data science career?
If yes, then you’ve landed on the right 5 part blog series which will provide you with all the practical information that you will need to derive real life value from data.
Is data science meant for me?
I think yes. As an economics post graduate and Principal Data Scientist at Atlan, I look at data science as a beautiful child of economics and computer science, that takes the best from both parents and forms its own shape and personality.
As economists, we are trained to understand and find patterns at all levels — micro and macro — as well as across varied domains such as development economics, agricultural economics, environmental economics, and others. We are trained in converting these patterns into mathematical equations to empirically test and communicate the results with relevant stakeholders.
A data scientist is someone who has the expertise of a trained economist along with the knowledge of working with big data, know-how of efficient usage of computer power and an engineering attitude of killing all repeatable tasks.
If you also feel that you understand some of these components of data science and have a knack for numbers, patterns, and an analytical bent of mind, then you can easily create a place for yourself in Data Science, just like I have. 🙂
What are career prospects in data science?
Data Science is rapidly changing the face of various industries with new innovations. Across organisations, data is now a core function like sales, marketing, or product and design.
Any company that has adopted data science has a competitive advantage over others in the industry because of the vast knowledge and faster learning and course-correction that the business becomes suddenly capable of. According to the 2018 Data Security Confidence Index from Gemalto, 89 percent of the people polled knew that if they could learn to analyse their information properly, they’d have a competitive edge.
In academia, research departments are learning data science and hiring experts to scale their research. Paul Romer, the winner of Nobel Prize in Economics in 2018, moved to Python from STATA and Mathematica to be able to benefit from its ability to handle massive and various types of datasets and gain the opportunity to share his work in the open source community.
Elections are being contested leveraging the power of data science across the world, be it the Brexit campaign or US election campaign done by Cambridge Analytica.
Across the world, this has led to a surge in the demand of data science professionals. In 2019, LinkedIn picked data science as the most promising career.
All this demand is not being catered to by the available supply. Indeed’s January 2019 report showed a 29% increase in demand for data scientists year-on-year and a 344% increase since 2013 — which is a dramatic upswing. But while demand has exploded — in the form of job postings — searches by job seekers skilled in data science has grown at a slower pace (14%), suggesting a vast and growing gap between supply and demand.
How is a day in the life of a data scientist?
Let’s take an example of a data science problem to understand this better.
Imagine that you or your company has been funded to predict monthly malaria cases for the next 2 years for every village and town of India.
Given that a whole host of factors can cause or accelerate the incidence of malaria, you need a lot of diverse data indicators coming in from a whole range of data sources: satellites for weather information, spatial directories for village locations, road network and more, statistical databases in PDF or excel format for hospital directory, income estimates, sanitation records, and more. All these datasets consist of different data types, geography granularity, and frequency of update.
As the data scientist on the job, you should be able to:
- Do background research on the problem statement and make an execution plan accounting restricted timelines, resources, and skillset of you and your team.
- Find and curate right datasets mapped to required indicators needed as per the problem statement
- Process and clean all different data types and bind them together
- Do explanatory analysis to find the right indicators/features of your prediction/forecasting model.
- Build a model that works for spatial data, time series data as well as cross sectional data.
- Write a script that can run every month with minimal human interference completing all steps including data sourcing, data cleaning, master database creation, running prediction model
- Create a regularly updated visualisation dashboard so that the insights can be consumed and shared with relevant stakeholders.
Looking at the problem statement, most of you, post research on malaria occurrence and prediction, would be able to design the solution and workflow but turning this into reality is the job of a data scientist.
So what all skills make a good data scientist?
Work, work, work…
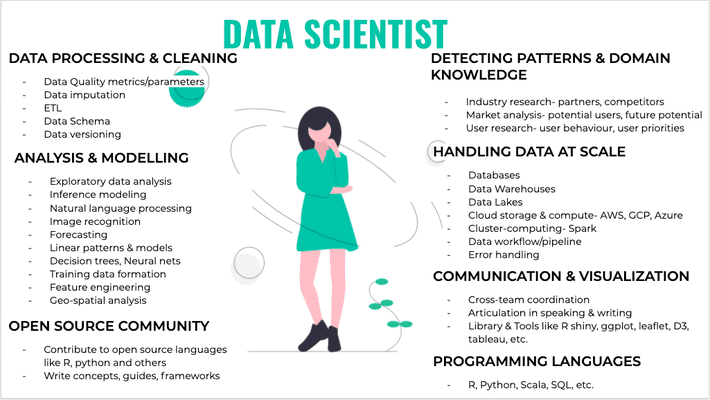
We will go deep into every component in the upcoming parts of the blog series. A brief for now:
Globally, a data scientist typically spends 80% of their time on data cleaning and preparation. Why is that? It’s because the data scientist has to deal with datasets that are of different data types, file formats, cleaning process, frequency of update, aggregation level, data size, and such other dimensions. Before getting to the analysis or modelling part, there is usually a huge time consuming process of data processing required to make sense of any data. Therefore, the ability to correctly automate data processing is one of the most desired skillsets of any data scientist.
- Analysis & modelling-
This would involve a deep understanding of statistics and mathematics to build and use various analytical or predictive ML models. Anyone who studies and enjoys mathematics and statistics, knows the basics by heart. Come on, just recite all OLS assumptions in your head now and you will know what I mean.. But, what we’re not taught are advanced ML techniques like XGboost, Support Vector machines, neural nets, and so on. As I set out to learn these techniques on-the-job, I realised that these are just more powerful extensions of the same statistical and mathematical models like logistic regression, linear optimisation, and bayesian probability that we have all studied as a part of our curriculum. We’re planning to go deep into these techniques later in the blog series.
- Programming languages-
Data science requires a lot of data wrangling, multiple model testing and optimisation along with visualisation to draw right insights, make inferences, do predictions or enable decisions. What’s more is that this needs to be done every day with varying data scale and capacity within the organisation. Therefore, knowing scripting programming languages that can best automate and optimise the work — from data cleaning to visualisation — is essential for any data scientist. R and python are most famously used programming languages used by data scientists but there are a lot more which we will discuss in detail in the coming section. Economists or statisticians are mostly taught STATA and basics of R or python in some universities, which is a good stepping stone but there is a long road ahead in learning how to write R or python scripts that are optimised for agility and speed.
- Handling data at scale-
Big data and production algorithms call for a highly optimised environment compared to a testing environment where we usually do data cleaning, ML models testing and so on.
This optimised environment comprises choosing the right database or data warehouse to store your data, right machine configuration where script will run, choosing the right libraries and package to do certain tasks in the script, and more such things. Not all these tasks are necessarily performed by data scientists, they are more of a concern for data engineers but as a small company or independent researcher you might not have this luxury, so having a working knowledge will be useful.
- Detecting patterns & domain knowledge-
These are probably the skills that you should be most proud of when entering the data science field. All other components of data science are tech-heavy but these are more reliant on human intuition and study of the domain, and is still very far from automation. The inherent skill here is to form out of the box hypotheses, look for patterns and back them by data, critically examine every step in the process flow, and connect data and mathematical models to the needs of the industry. These are skills that are inherent in a good economist, mathematician or statistician, and can be put to use to any industry or domain given one is passionate to learn about that domain.
- Communication & Visualisation-
Communication is a vital skill set for any data scientist. Given the nature of the job, data scientists are required to translate the models or predictions that they’ve built into actionable insights for the non-technical decision makers who will design a course of action on the basis of the data. Good communication is a function of various attributes which we will discuss in the coming article but one tool that really helps with communication is visualisation.
Visualisations come to the rescue when data scientists have to take huge amounts of data and complex models and outputs and make them understandable to an audience with limited time and attention span. As they say, “a picture is worth a thousand words”, and in my opinion, a good visualisation is worth a million. This also comes from the fact that humans inherently understand patterns and symbols better than any other language.
- Open Source Community-
Data Science community is build on some awesome open source tools, languages, frameworks, and written articles, wikis, blogs and books. Therefore, it is really important that we all contribute back through ways we can- writing blogs, contributing to R, python or any open source language, speaking at seminars, building public data dashboards (like one for COVID19), contributing data to open data repository like OSM or any other way you like.
So, what’s next?
Next up for you, is some reading and hands-on execution. As Thomas Edison famously said-, “Vision without execution is hallucination”.
My co-author Anika Mathur on this blog series and I hope to help you get started on this road of becoming a data scientist. This introductory blog will be followed by 4 more blogs in this series:
- Dirty Data- Quality Assessment & Cleaning Measures [Published]
- En route to ML- Take statistics & mathematics to next level [In Process]
- Scale it up- Programming languages, data storage & collaboration
- Spread the knowledge- Communication & Community
Expect these blogs to introduce you to different aspects of data science while giving you trusted resources to start your data science training. Happy hacking!