This article was written by Sondos Atwi.
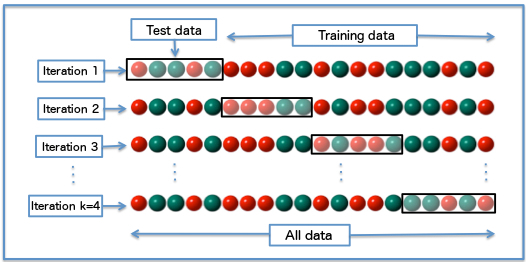
In Machine Learning, Cross-validation is a resampling method used for model evaluation to avoid testing a model on the same dataset on which it was trained. This is a common mistake, especially that a separate testing dataset is not always available. However, this usually leads to inaccurate performance measures (as the model will have an almost perfect score since it is being tested on the same data it was trained on). To avoid this kind of mistakes, cross validation is usually preferred.
The concept of cross-validation is actually simple: Instead of using the whole dataset to train and then test on same data, we could randomly divide our data into training and testing datasets.
There are several types of cross-validation methods (LOOCV – Leave-one-out cross validation, the holdout method, k-fold cross validation). Here, I’m gonna discuss the K-Fold cross validation method.
K-Fold basically consists of the below steps:
- Randomly split the data into k subsets, also called folds.
- Fit the model on the training data (or k-1 folds).
- Use the remaining part of the data as test set to validate the model. (Usually, in this step the accuracy or test error of the model is measured).
- Repeat the procedure k times.
How can it be done with R?
In the below exercise, I am using logistic regression to predict whether a passenger in the famous Titanic dataset has survived or not. The purpose is to find an optimal threshold on the predictions to know whether to classify the result as 1 or 0.
Threshold Example: Consider that the model has predicted the following values for two passengers: p1 = 0.7 and p2 = 0.4. If the threshold is 0.5, then p1 > threshold and passenger 1 is in the survived category. Whereas, p2 < threshold, so passenger 2 is in the not survived category.
However, and depending on our data, the 0.5 ‘default’ threshold will not always ensure the maximum the number of correct classifications. In this context, we could use Cross-validation to determine the best threshold for each fold based on the results of running the model on the validation set.
In my implementation, I followed the below steps:
- Split the data randomly into 80 (train and validation), 20 (test with unseen data).
- Run cross-validation on 80% of the data, which will be used to train and validate the model.
- Get the optimal threshold after running the model on the validation dataset according to the best accuracy at each fold iteration.
- Store the best accuracy and the optimal threshold resulting from the fold iterations in a dataframe.
- Find the best threshold (the one that has the highest accuracy) and use it as a cutoff when testing the model against the test dataset.
Note: ROC is usually the best method to be used to find an optimal ‘cutoff’ probability, but for sake of simplicity, i am using accuracy in the code below.
The below cross_validation method will:
- Create a ‘perf‘ dataframe that will store the results of the testing of the model on the validation data.
- Use the createFolds method to create nbfolds number of folds.
- On each of the folds:
- Train the model on k-1 folds
- Test the model on the remaining part of the data
- Measure the accuracy of the model using the performance method.
- Add the optimal threshold and its accuracy to the perf dataframe.
- Look in the perf dataframe for optThresh – the threshold that has the highest accuracy.
- Use it as cutoff when testing the model on the test set (20% of original data).
- Use F1 score to measure the accuracy of the model.
Then, if we run this method 100 times we can measure our max model accuracy when using cross-validation:
To read the whole article, with source code and examples, click here.
DSC Resources

