
Background
Many areas of AI continue to show innovation at an exciting pace.
For example, today, generative methods are on my radar. So, its nice to see innovation in an area which is stable and mature.
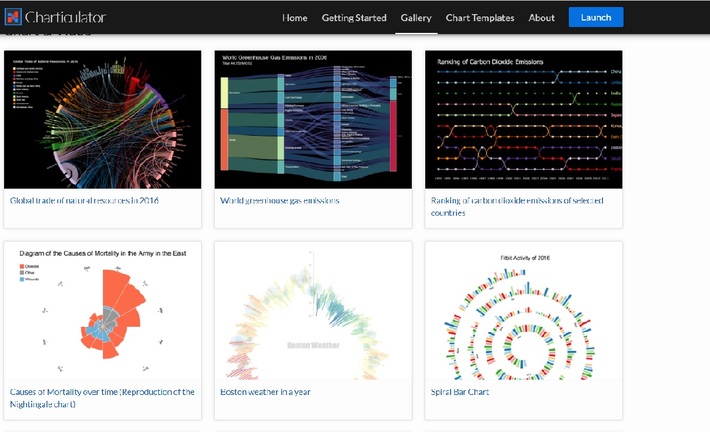
Charticulator from Microsoft research is a free and open source tool for creating bespoke Interactive Chart designs without the need for coding
A gallery of charticulator charts gives you an example of whats possible
What is the innovation?
While its visually interesting, its important to understand what is the innovation here
Charticulator is an interactive authoring tool that allows you to make custom and reusable chart layouts.
Typically, chart creation interfaces force authors to select from predetermined chart layouts, preventing the creation of new charts.
Charticulator, on the other hand, converts a chart specification into mathematical layout constraints and uses a constraint-solving algorithm to automatically compute a set of layout attributes to actualize the chart.
It enables the articulation of complex marks or glyphs and the structure between these glyphs, without the need for any coding or constraint satisfaction knowledge.
The capacity to build a highly customized visual representation of data, tuned to the specifics of the insights to be given, increases the chances that these insights will be recognized, understood and remembered in the final implementation.
This expressiveness also provides a competitive advantage to the creator of this visual representation in a landscape saturated with traditional charts and graphs.
The charticulator approach lies at the intersection of three ideas:
- People make charts by hand drawing or programming, in addition to using interactive charting tools. Because they cannot tie many aspects of data to graphical elements, illustration tools are insufficient for building custom charts.
- On the other hand, most interactive charting tools based on templates require chart authors to first select from a set of basic chart types or templates, such as bar, line, or pie charts and offer limited customization possibilities beyond that.
- Meanwhile, creating a powerful custom chart with a library like D3.js or a declarative language like Vega gives you a lot of control over how data is encoded to graphical markings and how they are laid out. However, this method is only available to a restricted set of people with advanced programming skills.
So, you could perhaps think that the innovation of charticulator lies in democratizing the custom chart approach and making it easier with no code / low code and therein lies the innovation IMHO
From a research standpoint, the following are the work’s significant research contributions:
- Charticulator’s design framework, which may be used to create a variety of reusable chart layouts.
- The implementation of Charticulator, a design framework that achieves the design framework by transforming the chart specification into layout constraints and incorporates a constraint-based layout algorithm and a user interface that allows interactive chart layout definition.
- The results of three types of testing: a gallery of charts to demonstrate Charticulator’s expressiveness, a chart reproduction study, and a click-count comparison versus three current tools
I think this is an exciting innovation – and also great that it is free and open source