
This article is by Claus Thorn Ekstrøm.
Debates about vaccines are ongoing in many countries and the debate has reblossomed in Denmark after we’ve had five recent occurrences of measels. While that is nothing compared to the measles outbreak currently ravaging Japanit is still enough to worry the health authorities that it might result in an epidemic. Here we’ll use Shiny to create an app that shows the impact of contagious diseases and the influence of vaccination. Wrapping the computations in a Shiny app will allow non-R-users to tweak the input parameters themselves and observe the consequences of an outbreak. Hopefully, this can lead to a more informed discussion about vaccination.
The SIR compartmental model
The susceptible-infectious-recovered (SIR) model is one of the simplest compartmental models and it has previously been successfully used to describe outbreaks of measles, the flu, small pox, mumps, and rubella. The SIR model is easily extended to accommodate immunities due to earlier infections or vaccinations. Implementing the SIR model in R has previously been documentedso in this post we will extend this previous work adding an additional component to accommodate previously vaccinated individuals, and warp everything in a Shiny app.
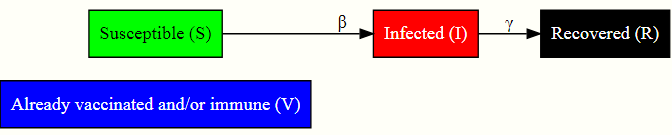
We will use a 4-compartment model where each individual in the population initially can be classified into 4 categories: susceptible (S), the infected (I), the recovered (R), and a group of previously vaccinated/immune (V) individuals. The number of individuals starting in compartment I will be very small since that is just the initial number of infected individuals, the initial number of persons in R will be zero since no one has yet had the disease and recovered from it as part of the current outbreak. The remaining individuals will be in either S (have not had the disease before) or V (vaccinated / immune from earlier infection). The setup is sketched in the diagram below. Adding the group V to the SIR model reduces the spread of the disease since the disease cannot infect individuals that it comes into contact with if they are already immune or vaccinated.
This variant of the SIR model is useful for modeling airborne diseases and in the model we disregard individuals who die from other causes than the disease, new vaccinations, and demographic changes in the population.
To compute the consequences of an outbreak we need to set some initial parameters for model. The parameters directly influencing the model are
- β – the transition rate from compartment S to I. This rate is defined as the basic reproductive number, R0, divided by the infection period (i.e., the average number of individuals each infected person will infect in an unprotected population divided by the number of days that the person can pass on the disease)
- γ – the transition rate from I to R. This is equal to the inverse of the disease period since once the disease period is over, a person automatically transfers to the R group.
Consequently we need to allow the user to set the following
- The reproductive number R0 – the average number of individuals that each infected person may infect, i.e., how contagious is the disease,
- the infection period,
- the population size,
- the number of individuals initially infected,
- the proportion of individuals in the immune/vaccine group V. This percentage should be multiplied by the vaccine effectiveness if it is not 100%.
- the time frame to consider.
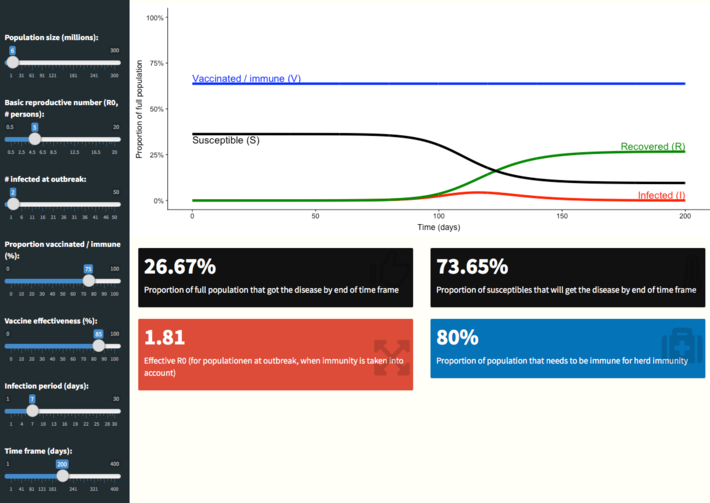
The Shiny App (click on picture to zoom in)
An example of these initial parameters is shown in the code below
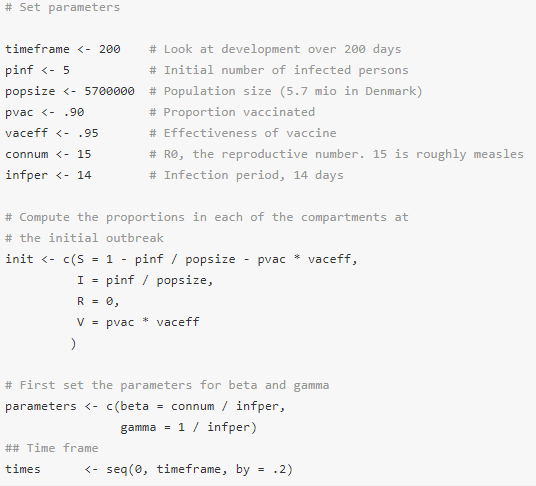
Read full article, with R code, here.
DSC Resources
- Free Book and Resources for DSC Members
- New Perspectives on Statistical Distributions and Deep Learning
- Deep Analytical Thinking and Data Science Wizardry
- Statistical Concepts Explained in Simple English
- Machine Learning Concepts Explained in One Picture
- Comprehensive Repository of Data Science and ML Resources
- Advanced Machine Learning with Basic Excel
- Difference between ML, Data Science, AI, Deep Learning, and Statistics
- Selected Business Analytics, Data Science and ML articles
- Hire a Data Scientist | Search DSC | Find a Job
- Post a Blog | Forum Questions
)