
Contributed by Frank Wang. He is currently in the NYC Data Science Academy 12 week full time Data Science Bootcamp program taking place between April 11th to July 1st, 2016. This post is based on his first class project – R visualization (due on the 2nd week of the program).
This note briefly reports the analysis of the NYC 2014 yellow taxi data. Records include pick-up and drop-off dates/times, pick-up and drop-off locations, trip distances, itemized fares, rate types, payment types, and driver-reported passenger counts. The motivation of this study is to learn the pattern behind the data, for instance, where the people to go? and when?
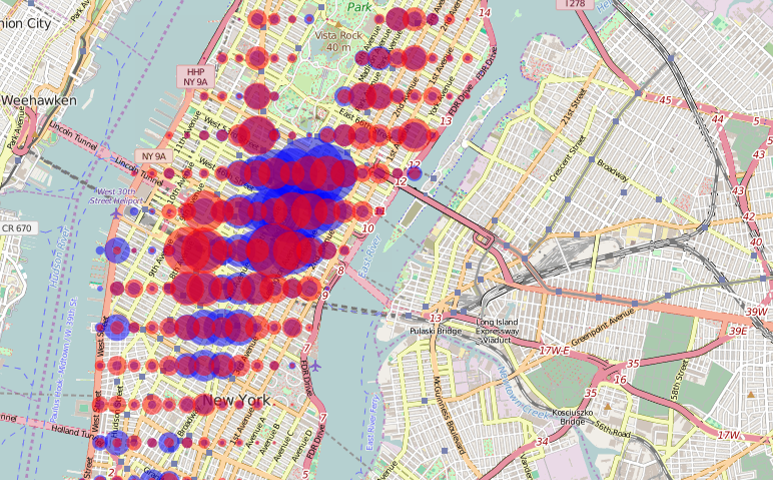
Where the most people go? The following two pictures show that large number of passengers head to the central area of the city (east of Time Square) in the morning time (top) while they leave the central area in the evening (Bottom). In the pictures, the red and blue dots represent pick-up and drop-off,respectively. The size of the circle is proportional to the number of taxi. In other words, people move from the red area to the blue area by taxi.


It is more interesting to explore the net flow of the taxi at a particular location and time. For this purpose, we divide the whole regime into small area and calculate the difference between the number of drop-off and pick-up as the net flow of the taxi at that area and that particular time. The net flow results are shown in FIG.2 for Friday morning time (top) and evening time (bottom). The red and blue dots represent more pick-up and drop-off, respectively, while the size of the dots represents the amount of difference. In other words, people leave the red area and arrive the blue area. In the morning time (top plot), people from the surrounding area flow to the central regime, while people leave central area in the evening (bottom). It is worthy to note that more people take taxi to Brooklyn, Queen and Harlem area in the evening time while they less likely take taxi at the morning time when they go to work. The two big circles on the right part of the pictures are located at LaGuardia Airport. There are similar number of pick-up and drop-off at morning time, but there are much more pick-up at evening time because more passengers arrive at evening time.


The hourly taxi activities for Friday, Saturday and Sunday are shown in the picture below. The hour starts from middle night of the day to the middle night of the next day. The vertical axis shows the total taxi income, which approximately represents the number of taxi on the road at that time. There is a minimum taxi activity around 5am for all the three days. There is a rush hour around 8-9am of the work day, while there is no such peak at the weekend. It is interesting to note that there is always a low taxi activity near 4pm. It is turn out that is correlated with taxi driver shift time. They change shift at that time. Therefore less number of taxi is available. This explains the puzzle why it is difficult to find a taxi near 4pm during the work day.

We also looked at the tip for different trips. The tip rate is similar for Friday, Saturday and Sunday as shown below. There are three peaks located at 17%, 20% and 23%, respectively. The tip rate for different hour at Friday is shown in FIG.5. It is interesting that passengers like to pay more tip around 4am and 4pm. However, there is no such clear pattern on the weekend.
Fig.6 shows the trip distance for the three days. Most of the trips are really short trip with median distance about 2 miles. This agrees with the data shown in FIG.1. The median trip time and cost is 10 minutes and $12, respectively.


Conclusions
- Large number of passengers go to the central area of the middle town in the morning time of the work day.
- More people, especially from Brooklyn, Queen and Harlem area, take taxi to home at evening time comparing the number of people taking taxi to work at morning time
- There is minimum daily taxi activity at 5am.
- It can be difficult to find a taxi around 4pm, especially during the weekday. This is correlated with the taxi driver schedule.
- People like to pay more tip at 4am and 4pm during the work day