
Why is graph visualization so important? How can it help businesses sifting through large amounts of complex data? We explore the answer in this post through 5 advantages of graph visualization and different use cases.
What is graph visualization
Also called network, a graph is a collection of nodes (or vertices) and edges (or links). Each node represents a single data point (a person, a phone number, a transaction) and each edge represents how two nodes are connected (a person possess a phone number for example). This way of representing data is well suited for scenarios involving connections (social networks, telecommunication networks, protein interactions, and a lot more).
Graph visualization is the visual representation of the nodes and edges of a graph. Dedicated algorithms, called layouts, calculate the node positions and display the data on two (sometimes three) dimensional spaces. Graph visualization tools provide user-friendly web interfaces to interact and explore graph data.
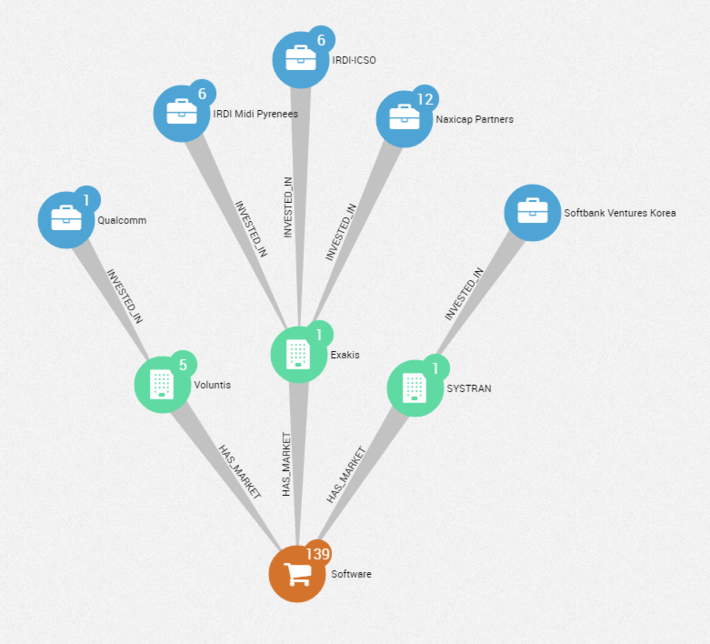
A simple graph visualization made with Linkurious Enterprise – 9 nodes representing investors (blue), companies (green) and market (orange) and 8 edges indicating how they are connected.
These graph visualizations are simply visualizations of data modeled as graphs. Any type of data asset that contains information about connections can be modeled and visualized as a graph, even data initially stored in a tabular way. For instance, the data from our example above could be extracted from a simple spreadsheet as depicted below.
| Company ID | Company name | Investors name | Market |
| 1 | Systran | Softbank Ventures Korea | Software |
| 2 | Exakis | Naxicap Partners; IRDI-ICSO; IRDI Midi Pyrenees | Software |
| 3 | Voluntis | Qualcomm | Software |
A table-based model of our first example
The data could also be stored in a relational database or in a graph database, a system optimized for the storage and analysis of complex and connected data.
In the end, graph visualization is a way to better understand and manipulate connected data. And it offers several advantages.
The benefits of graph visualization
Interactive visualization tools are an essential layer to identify insights and generate value from connected data. There are a number of reasons why graph visualization is useful:
- You will spend less time assimilating information because the human brain processes visual information much faster than written one. Visually displaying data ensures a faster comprehension which, in the end, reduces the time to action.
- You have a higher chance to discover insights by interacting with data. Graph visualization tools offer the possibility to manipulate the data. It encourages data appropriation, its questioning and in the end increases the possibility to discover actionable insights. A study showed that managers who use visual data discovery tools are 28% more likely to find timely information, than those who rely solely on managed reporting and dashboards.
- You can achieve a better understanding of a problem by visualizing patterns and context. Graph visualization tools are perfect to visualize relationships but also to understand the context of the data. You get a complete overview of how everything is connected which allows to identify trends and correlations in your data.
- It’s an effective form of communication. Visual representations offer a more intuitive way to understand the data and are an impactful medium to share your findings with decision-makers.
- Everybody can work with graph visualization, not only technical users. More users can access the insights since specific programming skills are not required to interact with graph visualizations. This increases the value creation potential.
Let’s illustrate some of these benefits with a very simple example. We have a data sample of eleven individuals with information about who works with who. Below is the same data sample in two formats: a table and a graph visualization.
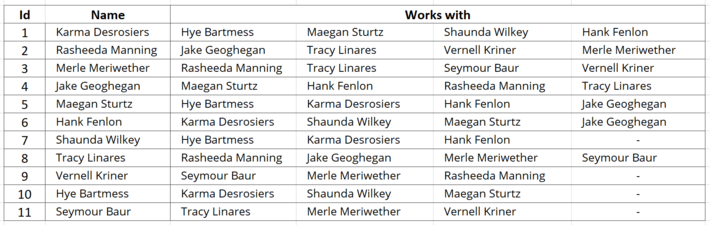
Table of our data sample (click for full view)
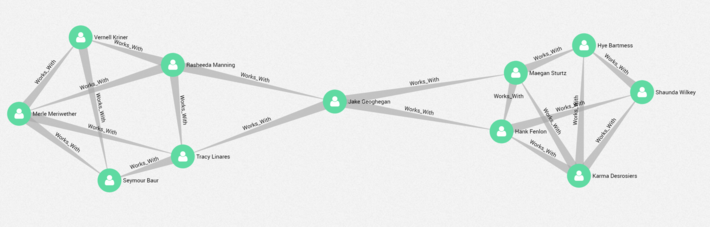
Graph visualization of our data sample (click for full view)
In our second format, we’ve modeled the connections between persons as edges to obtain a graph.
While in the first table it’s pretty hard to understand how those people work together, we get a clearer view with the graph visualization. We are able to distinguish two groups and an individual who seems to be the link between them, a pattern that we did not notice at first in the table.
How graph visualization is being used
Many industries are using graph technology to leverage their connected data and reach their goals. At Linkurious, we work with companies from a large variety of fields. Their common point, however, is the need to find connections or understand dependencies within their data. Below are a few examples of typical use-cases of graph visualization and the organizations who use it.
Anti-Financial crime
Banks, insurance companies, and financial institutions have a common urgency to face: fraud. From money laundering to insurance fraud to bank fraud, each of these organizations is required to detect, sometimes complex, fraud schemes. The data visualized often combine customer information, claims details, financial records, watch-listed individuals or organizations. For them, graph visualization is a good way to detect suspicious connections or patterns. It’s also an intuitive way to investigate fraud rings and criminals networks ramifications.
Cybersecurity
Today you’ll find cyber, or IT, security in many large organizations, financial institutions, and security consultancy services. Organizations need to protect themselves from vulnerabilities like zero-day vulnerabilities and DDoS or phishing attacks. They collect data from servers, routers or application logs and network status in order to detect suspicious activity. Graph visualization is a great tool to digest this data and detect suspicious patterns in a glimpse. It makes the finding of compromised elements easier thanks to the visual exploration of connections.
Intelligence
Almost every government has its intelligence agency. To support law enforcement, national security or military objectives, these organizations collect and analyze data from various sources. The detection and identification of terrorist networks, for instance, became a crucial objective in the past decades. Visualizing connections between people, emails, transactions or phone records is a key to ease such investigations.
IT operations management
The field of IT operations management keeps growing with our increasing reliance on computer systems, networks and the growth of the Internet of Things. But because of the growing complexity of infrastructures, managing networks is often a challenge. Graph visualization allows IT managers to visualize dependencies between their assets (servers, switches, routers, applications, etc). It’s an intuitive way to perform impact or root cause analysis.
Enterprise architecture
Numerous mature organizations implement enterprise architecture management. It consists of synchronizing business and IT data. The goal is to analyze, plan and transform the business processes, applications, data and infrastructure to maintain the organization ability to change and innovate. With graph visualization, enterprise architects can visualize the organization assets and their dependencies. It helps to conduct impact analysis, obtain insights on the current situation (as-is) and plan the right actions.
Life science
Protein interactions, drug compositions, disease networks: for life science data analysis almost everything is about connections and dependencies. However, the large amount of data often makes it difficult for researchers to identify insights and look for dependencies. Graph visualization makes large amounts of data more accessible and easier to read. It has many different applications, from linking drugs with adverse events and diseases with phenotypes to visualizing network or understand how diseases spread.
This article was initially posted on Linkurious blog