
This article is by Jorge Castañón, Ph.D., Senior Data Scientist at the IBM Machine Learning Hub.
Data visualization plays two key roles:
1. Communicating results clearly to a general audience.
2. Organizing a view of data that suggests a new hypothesis or a next step in a project.
It’s no surprise that most people prefer visuals to large tables of numbers. That’s why clearly labeled plots with meaningful interpretation always make it to the front of academic papers.
This post looks at the 10 visualizations you can bring to bear on your data — whether you want to convince the wider world of your theories or crack open your own project and take the next step:
- Histograms
- Bar/Pie charts
- Scatter/Line plots
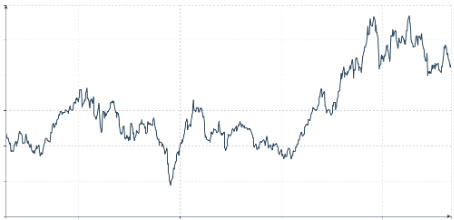
- Time series
- Relationship maps
- Heat maps
- Geo Maps
- 3-D Plots
- Higher-Dimensional Plots
- Word clouds
Read the full article, with descriptions and illustrations for these visualizations, here.