
This article is written by Gunnar Carlsson.
Topological data analysis has been very successful in discovering information in many large and complex data sets. In this post, I would like to discuss the reasons why it is an effective methodology.
One of the key messages around topological data analysis is that data has shape and the shape matters. Although it may appear to be a new message, in fact it describes something very familiar.
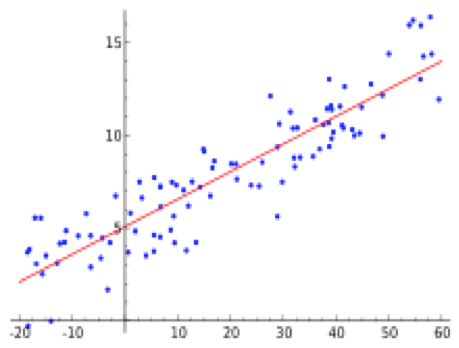
The example above is a regression line, obtained by fitting a straight line to the data points using a natural measure of fit. A straight line is certainly a shape, and in the above example, we find that a straight line fits the given data quite well. That piece of information is extremely important for a number of reasons. One is that it gives us the qualitative information that the y-variable varies directly with the x-variable (i.e. that y increases as x increases). Another is that it permits us to predict with reasonable accuracy one of the variables if we know the value of the other variable. The idea is that the shape of a line is a useful organizing principle for the data set, which permits us to extract useful information from it.
Unfortunately, the data does not always cooperate and fit along a line. Consider, for example, the data set below.
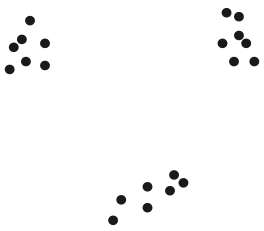
It is easy to see that no straight line faithfully represents this data.
The reason is that this data set breaks into a set of three tightly concentrated clusters. One might not initially think of this as having anything to do with shape, but after a moment’s reflection, we realize that the most fundamental aspect of any shape is the number of connected pieces it breaks into. So, in this case, we see that the shape of this data set is of fundamental importance, and that its shape is not that of a line.
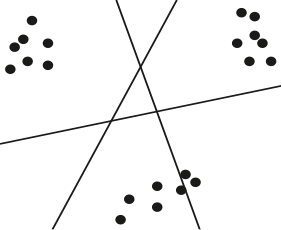
At this point, we might think that we could now proceed by assuming that any data set is well approximated by a line, a family of clusters, or perhaps a family of lines. Here is another data set that demonstrates that this is not the case.

Notice that this shape also does not fit along a line, and does not break into clusters, but rather has a “loopy” behavior. This kind of structure is often associated with periodic or recurrent behavior in the data set. Here is another example.
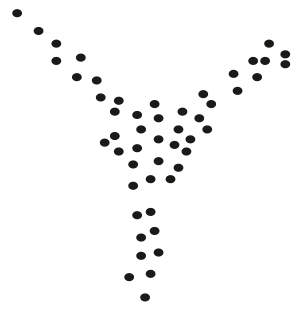
The shape is in this case that of a capital letter “Y”. This is another kind of shape, which also occurs frequently. Note that it has a central core and three “flares” extending from it. This might represent a situation where the core represents the most frequently occurring behaviors, and the tips of the flares represent the extreme behaviors in the data. It is clearly distinct from the three other shapes we have already discussed.
One might now say that a way to understand data would be to take each of these types, and attempt to fit a template for each to the data to determine which type one is in. This fitting process is what is done in linear regression, which is the first example above. The problem with this approach is that there are an infinite variety of different possible shapes, a large number of which occur in real data sets. All four that we have shown certainly do, but many others do as well, as demonstrated in the image below.
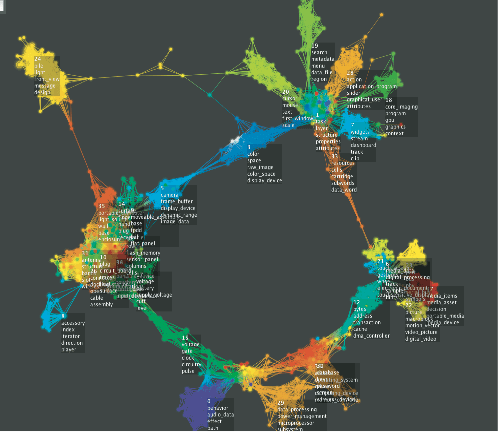
The immense variety possible among shapes suggests that we should not attempt to enumerate all the possible shapes, and create templates for each, but rather find a flexible way of representing all shapes.
To read the full original article click here. For more topological data analysis related articles on DSC click here.
DSC Resources
- Services: Hire a Data Scientist | Search DSC | Classifieds | Find a Job
- Contributors: Post a Blog | Ask a Question
- Follow us: @DataScienceCtrl | @AnalyticBridge
Popular Articles