
 Examples of the worst models built during the Covid-19 pandemic.
- Reasons why pandemic modeling is fraught with issues.
- Some successful models may offer hope for the future.
 Examples of the worst models built during the Covid-19 pandemic.
Covid-19 forecasting efforts fell apart at the seams, despite experienced modelers, sophisticated tools, and the best of intentions. Conflicting models throughout the pandemic led to mixed messages, Draconian lockdowns, and ineffective containment measures. While pandemic modeling got off to a faltering start, some of the newer models provide hope going forward.
Examples of the Worst Models
Perhaps the most famous examples of bad models include one from the White House that heralded the immediate end of the pandemic (along with a nation of walking dead), and one from the Imperial College of London that over-estimated deaths threefold.
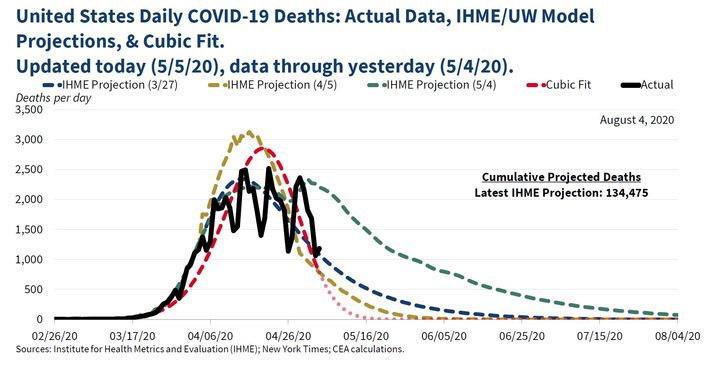
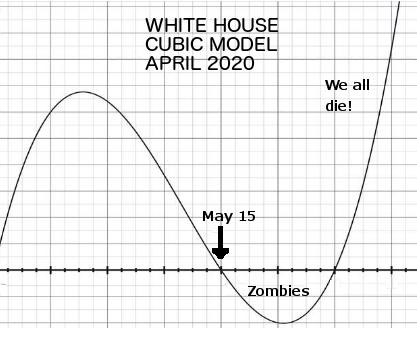
The White Houses cubic-fit graph, shown at the top of this post, reassured Americans that the pandemic would end abruptly in May of 2020 [1]. This model was widely panned, mostly because it took exponential data and forced it to fit a cubic function. Anyone with a modicum of modeling experience knows that if you fit data to a cubic model, what comes down will surely rise again. The following tongue-in-cheek graph, posted by clinical statistician Jonathan Siegel on The American Statistical Associations Community site [2] shows exactly why the cubic fit was so problematic:
Around the same time (Spring of 2020), the Imperial College of London predicted a completely different outcome, estimating 2.2 million deaths in the U.S. from Covid-19 [3], far beyond the 600,000 deaths to date: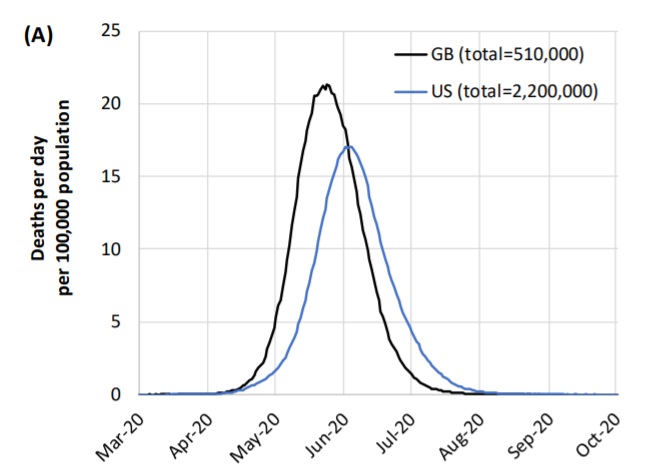
While those two models are extremes, most models created during the pandemic were unreliable.
What Went Wrong?
In general, the major issue was a result of incorrectly generalizing data from one country to another. There are several reasons for this. The major reason is that geography and cultural factors vary widely from country to country. For example, Africa has a relatively young population, which may explain why the continent has a lower rate of confirmed deaths. Covid-19 is also disproportionally hitting poor and vulnerable counties [4]; Within borders, the picture is equally bleak, with socially vulnerable neighborhoodsthose with residential segregation and with a history of systematic disinvestmentsuffering more from the pandemic than their more affluent neighbors.
Other issues that affected models:
- Data collection variations. For example, COVID-19 daily death figures earlier in the pandemic tended to include those dying in hospitals, but while France included care home deaths in their tallies, England did not [5].
- Incomplete data. Some countries, like South Korea, quickly adopted blanket testing for Covid-19; Others prioritized testing for frontline workers and hospitalized patients–which inflated the death count per confirmed case. In Florida, more than 300 labs around the state only reported positive test cases, leaving out negative test results and making it difficult to track the spread of the virus or create reliable estimates for the positivity rate [6].
- The pandemic has not behaved as expected. Epidemiologist Professor C. Donnelly of Imperial College London told BBC Radio 4s statistics program More or Less [7]: The more dense the population, the more you would expect transmission to happen. But this is not what happened: while some cities like Singapore successfully contained the virus, some rural communities became virus hotspots. For example, Dougherty County in southwest Georgia recorded more deaths at the onset of the pandemic than Atlantas Fulton County [8].
- Death rates are complicated. At first glance, excess deaths seems like a straightforward statistic, defined as the difference between observed and expected deaths (based on historical information) in specific time periods [9]. However, there are major discrepancies in excess deaths data and exactly why this is so has been quietly debated, as has usefulness of death rates in judging which countries have been successful, and which have not, in battling the pandemic.
There are many other factors that affected forecasts. Even before the pandemic, epidemic forecasting had a notoriously poor track-record–fraught with issues like poor data input, selective reporting, and wrong modeling assumptions [10]. In short, the science was not ready for a major pandemic, making it nearly impossible for effective government actions.
Epidemic Modeling Going Forward
The news isnt all bad for epidemic modeling. Models have been tweaked, and new modeling methods have been applied with superior results. For example, one paper by V. Moreau showed that the Weibull Distribution to Model COVID-19 Epidemic Data could successfully describe the appearance of cases and deaths in different countries [11]. Another, by S. Safi and O. Sanusi showed that a hybrid of traditional and non-traditional models–Artificial Neural Network, Exponential Smoothing, and ARIMA gave better results than one of these methods, successfully forecasting main pandemics indicators [12].
Lets hope that we dont have another major pandemic in our lifetime. And if we do, lets hope that the lessons learned from Covid-19 modeling will result in better forecasts, more effective pandemic control, and fewer deaths.
References
[1] White House’s Self Serving Approach Estimating Deadliness of Corona…
[3] Imperial College COVID19 NPI modelling
[4] Covid 19 hitting poor countries hardest
[5] 3 reasons we can’t compare countries’ coronavirus responses
[6] Florida changes COVID reporting requirements, saying labs did not s…
[7] Comparing countries, the risk to NHS staff, and birdsong
[8] COVID-19 may hit rural residents hard, and that spells trouble beca…
[10]Forecasting for COVID-19 has failed
[11] Using the Weibull Distribution to Model Covid-19 Data
[12] A Hybrid of Artificial Neural Network for COVID-19 Time Series Fore…