
All the data we need today is already available on the internet, which is great news for data scientists. The only barrier to using this data is the ability to access it. There are some platforms that even include APIs (such as Twitter) that support data collection from web pages, but it is not possible to crawl most web pages using this advantage..
This article is written by Olgun Aydin, the author of the book R Web Scraping Quick Start Guide.
Before we go on to scrape the web with R, we need to specify that this is advanced data analysis, data collection. We will use the Hadley Wickham’s method for web scraping using rvest. The package also requires selectr and xml2 packages.
The way to operate the rvest pole is simple and straightforward. Just as we first made web pages manually, the rvest package defines the web page link as the first step. After that, appropriate labels have to be defined. The HTML language edits content using various tags and selectors. These selectors must be identified and marked for storage of their contents by the harvest package. Then, all the engraved data can be transformed into an appropriate dataset, and analysis can be performed.
rvest is a very useful R library that helps you collect information from web pages. It is designed to work with magrittr, inspired by libraries such as BeatifulSoup.
To start the web scraping process, you first need to master the R bases. In this section, we will perform web scraping step by step, using the rvest R package written by Hadley Wickham.
For more information about the rvesr package, visit the following URLs.
CRAN Page: https://cran.r-project.org/web/packages/rvest/index.html rvest on github: https://github.com/hadley/rvest.
After talking about the fundamentals of the rvest library, now we are going to deep dive into web scraping with rvest. We are going to talk about how to collect URLs from the website we would like to scrape.
We will use some simple regex rules for this issue. Once we have XPath rules and regex rules ready, we will jump into writing scripts to collect data from the website.
We will collect a dataset from a blog, which is about big data (www.devveri.com). This website provides useful information about big data, data science domains. It is totally free of charge. People can visit this website and find use cases, exercises, and discussions regarding big-data technologies.
Let’s start collecting information to find out how many articles there are in each category. You can find this information on the main page of the blog, using the following URL: http://devveri.com/ .
The screenshot shown is about the main page of the blog.
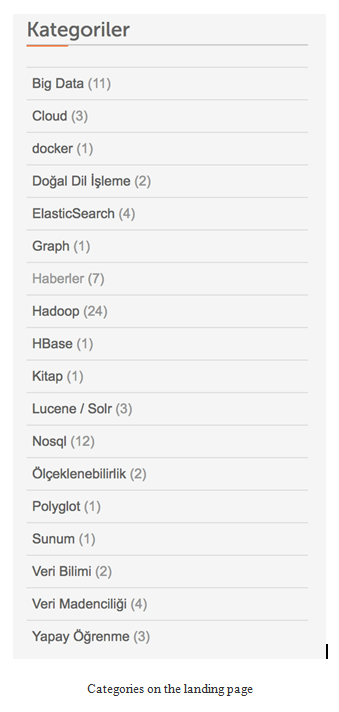
- As you see on the left-hand side, there are articles that were published recently. On the right-hand side, you can see categories and article counts of each categories:
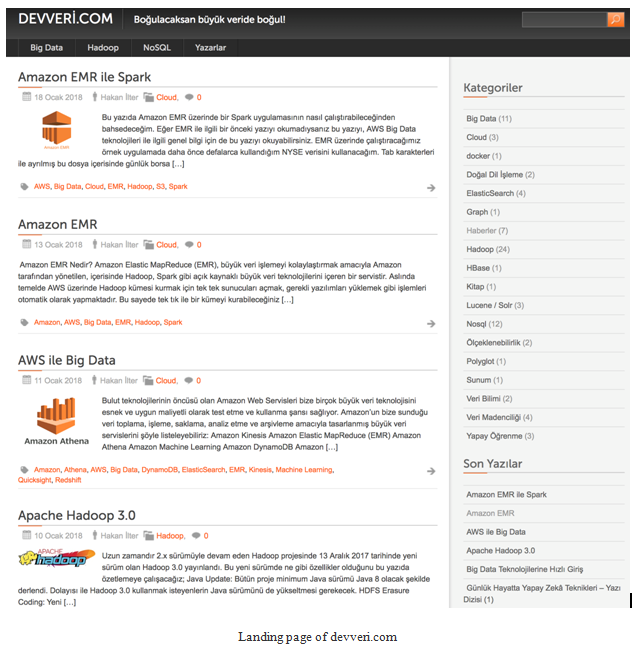
- To collect the information about how many articles we have for each categories, we will use the landing page URL of the website. We will be interested in the right-hand side of the web page shown in the following image:
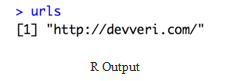
- The following codes could be used to load the library and store the URL to the variable:
library(rvest)
urls<- “http://devveri.com/”
- If we print the URLs variable, it will look like the following image on the R Studio:
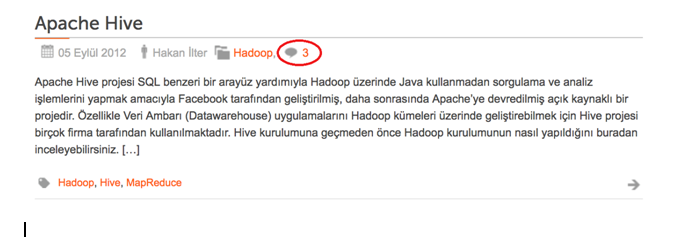
Now let’s talk about the comment counts of the articles. Because this web page is about sharing useful information about recent technologies regarding current development in the big-data and data science domain, readers can easily ask questions to the author or discuss about the article with other readers easily just by commenting to articles.
Also, it’s easy to see comment counts for each article on the category page. You can see one of the articles that was already commented on by readers in following screenshot. As you see, this article was commented on three times:
Now, we are going to create our XPath rules to parse the HTML document we will collect:
- First of all, we will write XPath rules to collect information from the left-hand side of the web page, in other words, to collect information about how many articles there are for each categories.
- Let’s navigate the landing page of the website com. As we exercised in previous chapter, will use Google Developer Tools to create and test XPath rules.
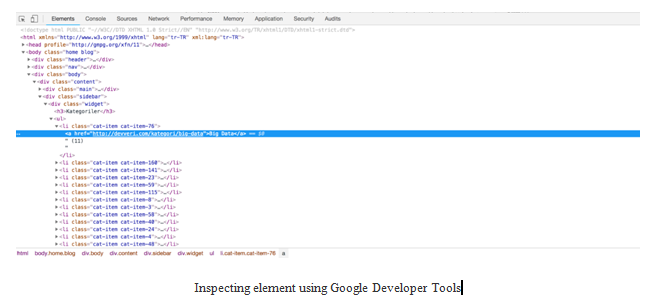
- To use Google Developer Tools, we can right-click on an element, which we are interested in extracting data from.
- Click Inspect Element.
- On the following screenshot, we marked the elements regarding categories:
- Let’s write XPath rules to get the categories. We are looking for the information about how many article there are for each categories and the name of the categories:
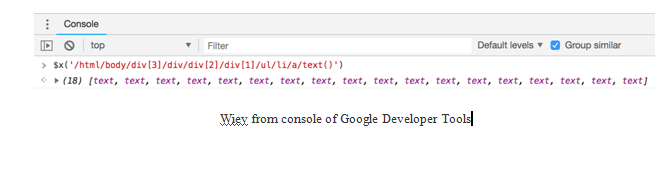
$x(‘/html/body/div[3]/div/div[2]/div[1]/ul/li/a/text()’)
- If you type the XPath rule to the console on the Developer Tools, you will get the following elements. As you can see, we have eighteen text elements, because there are eighteen categories shown on the right-hand side of the page:
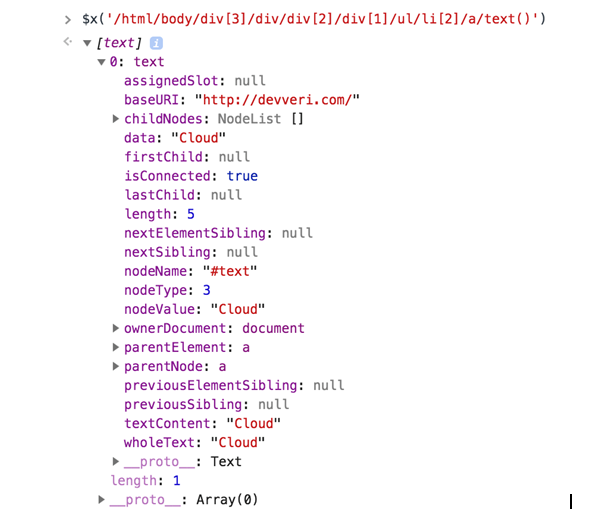
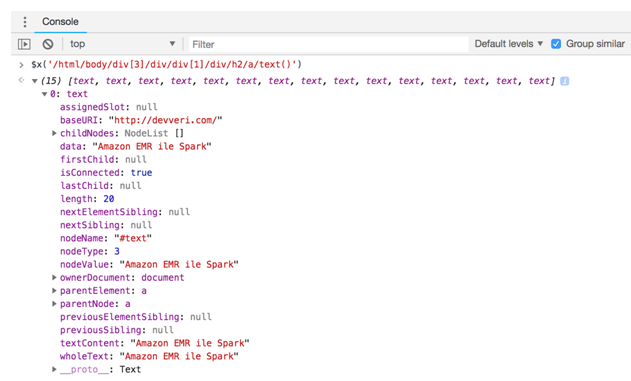
- Let’s open a text element and see how it looks. As you see, we managed to get the text content, which we are interested in.
In the next part, we will experience how to manage to extract this information with R. As you can see from the wholeText section, we only have category names:
Still, we will need to collect article counts for each categories:
- Use the following XPath rule; it will help to collect this information from the web page.
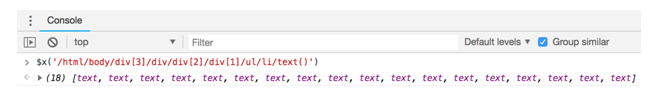
$x(‘/html/body/div[3]/div/div[2]/div[1]/ul/li/text()’)
- If you type the XPath rule to the console on the Developer Tools, you will get the following elements.
As you can see, we have 18 text elements, because there are eighteen categories shown on the right-hand side of the page:
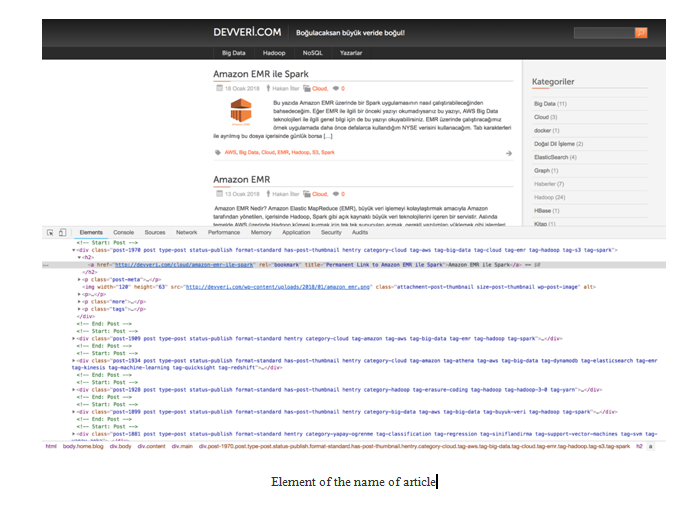
Now it’s time to start collecting URLs for articles. Because, at this stage, we are going to collect comment counts for articles that were written recently. For this issue, it would be good to have the article name and the date of the articles. If we write the name of the first article, we will get the element regarding the name of the article, as shown in the following screenshot:
- Let’s write XPath rules to get the name of the article. We are looking for the name of the article:
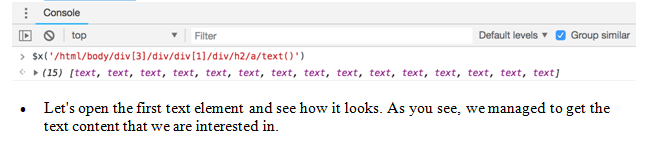
$x(‘/html/body/div[3]/div/div[1]/div/h2/a/text()’)
- If you type the XPath rule to the Developer Tools console, you will get the following elements. As you can see, we have 15 text elements, because there are 15 article previews on this page:
In the next part, we will experience how to extract this information with R:
We have the names of the articles, as we decided we should also collect the date and comment counts of the articles:
- The following XPath rule will help us to collect created date of the articles in text format:
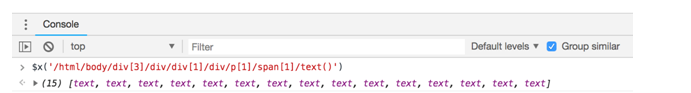
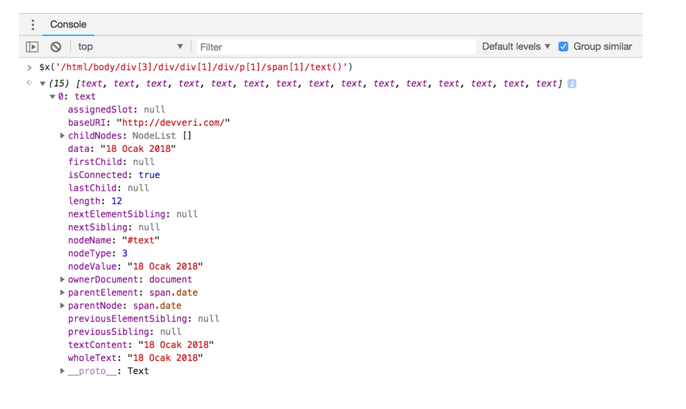
$x(‘/html/body/div[3]/div/div[1]/div/p[1]/span[1]/text()’)
- If you type the XPath rule on the Developer Tools console, you will get the elements, as shown in the following screenshot:
As you can see, we have 15 text elements regarding dates, because there are 15 article previews on this page:
- Let’s open the first text element and see how it looks.
As you can see, we managed to get the text content that we are interested in. In the next part, we will experience how to extract this information with R:
We have the names of the articles and have created dates of the articles. As we decided, we should still collect the comment counts of the articles:
- The following XPath rule will help us to collect comment counts:
$x(‘/html/body/div[3]/div/div[1]/div/p[1]/span[4]/a/text()’)
- If you type the XPath rule to the Developer Tools console, you will get the elements, as shown in the following screenshot.
As you can see, we have 15 text elements regarding comment counts, because there are fifteen article previews on this page:
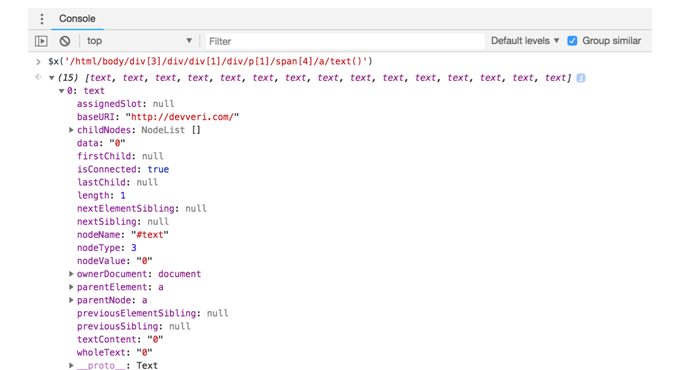
- Let’s open the first text element and see how it looks.
You see, we managed to get the text content that we are interested in. In the next part, we will experience how to extract this information with R:
Let’s start to write our first scraping using R. We have already created XPath rules and URLs that we are interested in. We will start by collecting category counts and information about how many articles there are for each category:
- First of all, we have called an rvest library using the library function. We should load the rvest library using the following command:
library(rvest)
- Now we need to create NULL variables, because we are going to save count of articles for each categories and the name of the categories.
- For this purpose, we are creating category and count variables:
#creating NULL variables
category<- NULL
count <- NULL
- Now it’s time to create a variable that includes the URL that we would like to navigate and collect data.
- As we mentioned in the previous section, we would like to collect data from first page of the website. By using the following code block, we are assigning a URL to the URLs variable:
#links for page
urls<- “http://devveri.com/”
Now for the most exciting part: Collecting data!
The following script is first of all visit the URL of the web page, collecting HTML nodes using the read_html function. To parse HTML nodes, we are using XPath rules that we have already created in the previous section. For this issue, we are using the html_nodes function, and we are defining our XPath rules ,which we already have, inside the function:
library(rvest)
#creating NULL variables
category<- NULL
count <- NULL
#links for page
urls<- “http://devveri.com/”
#reading main url
h <- read_html(urls)
#getting categories
c<- html_nodes(h, xpath = ‘/html/body/div[3]/div/div[2]/div[1]/ul/li/a/text()’)
#getting counts
cc<- html_nodes(h, xpath = ‘/html/body/div[3]/div/div[2]/div[1]/ul/li/text()’)
#saving results, converting XMLs to character
category<- as.matrix(as.character(c))
count<- as.matrix(as.character(cc))
- We can use the framefunction to see categories and counts together.
- You will get the following result on R, when you run the script on the first line as shown in the following code block:
>data.frame(category,count)
category count
1 Big Data (11)\n
2 Cloud (3)\n
3 docker (1)\n
4 DoğalDilİşleme (2)\n
5 ElasticSearch (4)\n
6 Graph (1)\n
7 Haberler (7)\n
8 Hadoop (24)\n
9 HBase (1)\n
10 Kitap (1)\n
11 Lucene / Solr (3)\n
12 Nosql (12)\n
13 Ölçeklenebilirlik (2)\n
14 Polyglot (1)\n
15 Sunum (1)\n
16 VeriBilimi (2)\n
17 VeriMadenciliği (4)\n
18 YapayÖğrenme (3)\n