
The third annual University of San Francisco (USF) MBA class Golden State Warriors analytics exercise provided an opportunity to test the students’ ability to “Think Like a Data Scientist” with respect to identifying and quantifying variables that might be better predictors of performance for the Golden State Warriors professional basketball team. This was also an opportunity to test and fine-tune the Hypothesis Development Canvas, and boy was that an eye-opener for me. The Hypothesis Development Canvas works, but I need to do a better job of explaining how to use it properly. Here are just a few of my learnings from the USF exercise:
- The Hypothesis is a “Business Outcomes” hypothesis (versus a statistical hypothesis). Consequently, the Hypothesis needs to clearly articulate what it is that the students are trying to prove or improve with their data science project.And the business hypothesis must be actionable with clear impact on the generated Business Value. For example, “Winning the upcoming games while reducing player ‘wear-and-tear’” for GS Warriors exercise.
- KPI’s and Metrics. Need to spend more time on identifying the KPI’s against which success and progress will be measured, and then understanding the business and operational ramifications of the under-performance and over-performance of those KPI’s. For example, what are the metrics that can be used to measure reducing player wear-and-tear? Examples could include minutes played per game, minutes played consequently, consecutive minutes of rest, number of games of rest (Did Not Play).
- Business Value.This should tie directly to how proving out the business hypothesis impacts the finances, operations and customers, such as increased revenues, increased profits, and improve customer satisfaction. This should be the basis for creating an ROI calculation and should tie to some of the metrics against which we are going to measure success.
- These are the risks are associated with the costs of False Positives and False Negatives; that is, the costs associated with the analytic model being wrong.Sample risks could be resting key players too much or not enough that has short-term impact on winning games and longer-term impacts on player injuries.
Okay, so we’ll continue to test and continue to refine the Hypothesis Development Canvas. Oh, the life of a Data Scientist…
Golden State Warriors Exercise
Scenario: You have been hired by Golden State Warriors to review in-game performance data to quantify metrics that predict the keys to the Warriors victories in upcoming games against the Brooklyn Nets (10/28) and the Chicago Bulls (10/29).
Purpose: Apply “Thinking Like a Data Scientist” approach to identify and quantify variables that might be better predictors of in-game performance. In particular, track how much time the team spends doing the following:
- Setting up a simple analytic environment
- Gathering and preparing data
- Exploring the data using simple data visualization techniques
- Creating and testing composite metrics (scores) by grouping and transforming base metrics
- Creating a score or analytic model that supports your recommendations
Keys to Success:
- Analytic results must be insightful and actionable (recommendations)
- Describe and defend your analytic process
Check out Figure 1 which summarizes the results of the “Golden State Warriors Data Analytics Exercise” 2017 class exercise, and actually provides the first indication that we could create a document to guide our “Think Like a Data Scientist” process.
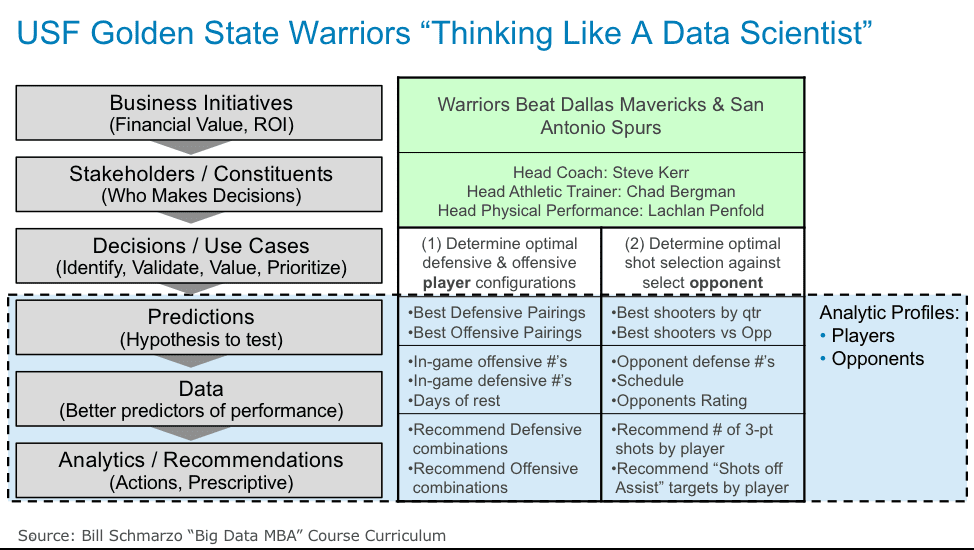
Figure 1: 2017 Golden State Warriors Results
Student Examples
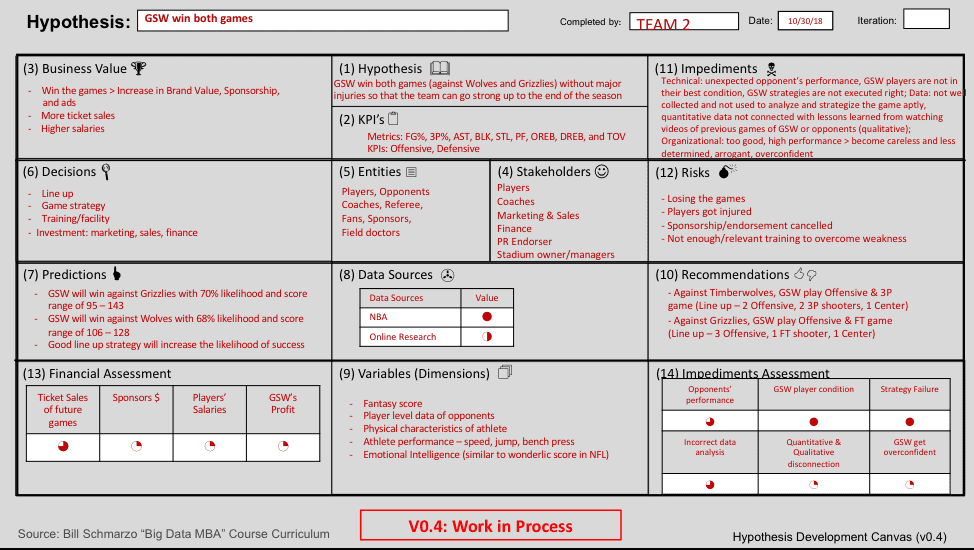
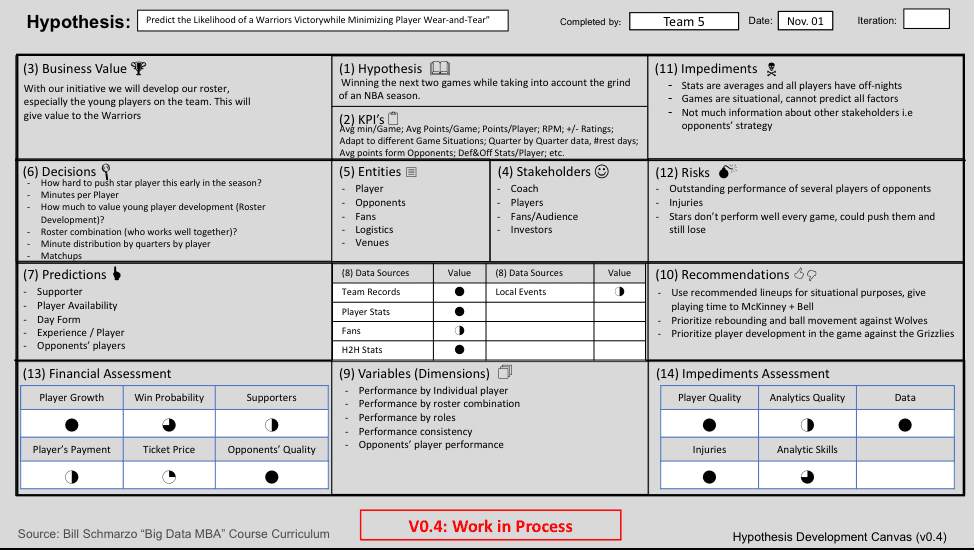
All of the teams got it this year, which was an improvement over previous years when there was a team or two that struggled with the assignment. I’ve provided just three examples below due to keep the blog concise, but each of the teams did outstanding work.
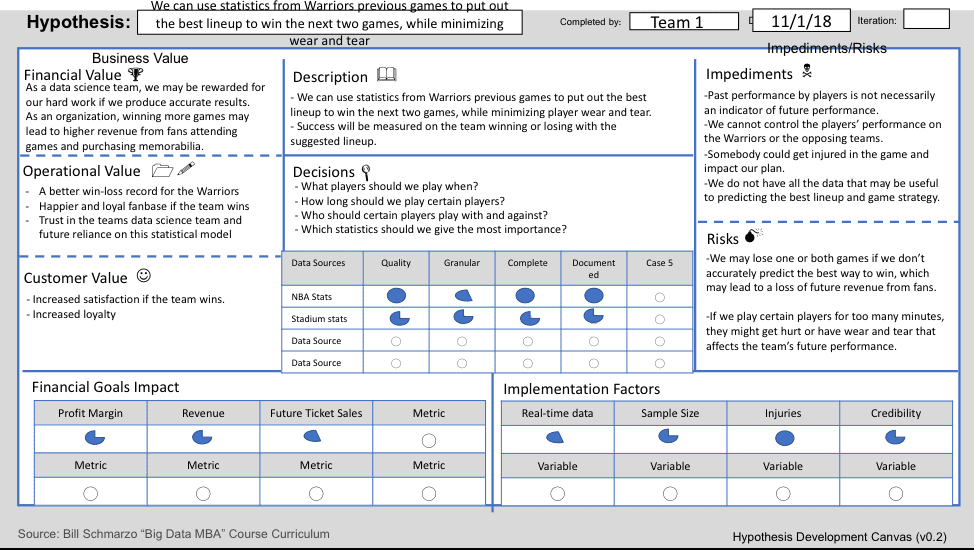
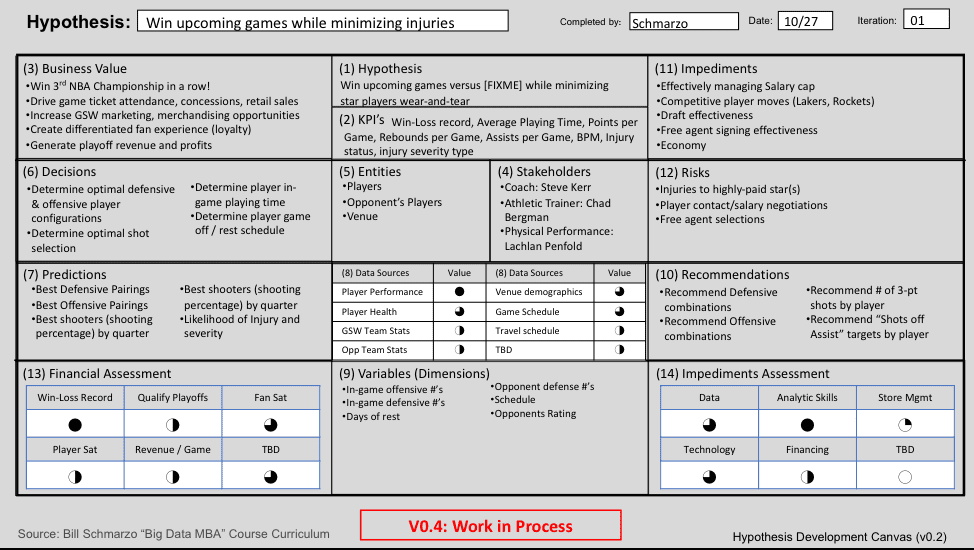
And finally, my version of the Golden State Warrior Exercise Hypothesis Development Canvas:
Bonus: External Contribution
As a bonus contribution, Alex ChandyCEO 2DA Analytics, took up the challenge and contributed the Hypothesis Development Canvas below concerning “Lowering Inventory Costs”.
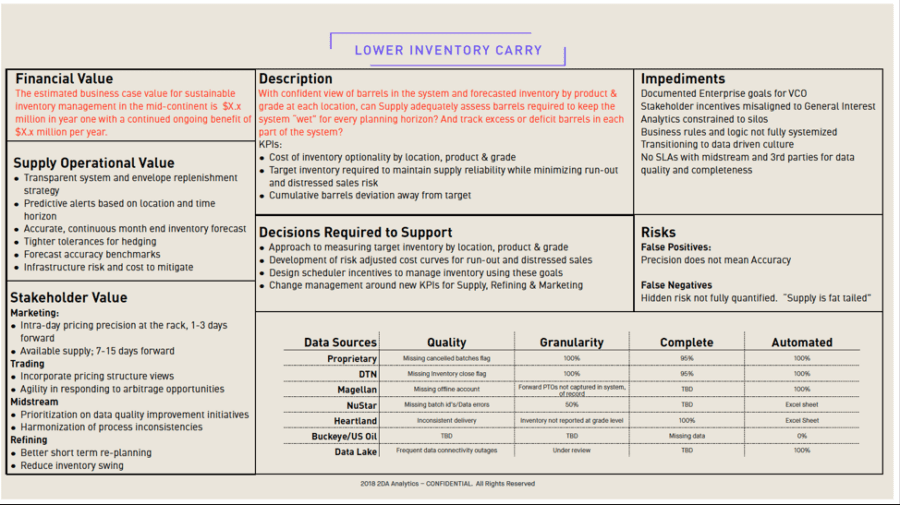
Thanks Alex for being a part of our learning experience! I love the level of detail he put into the canvas, and I in particular, greatly appreciate his willingness to share his work with everyone else. Working together, we can share, learn and improve.
Isn’t that the real promise of social media?
I encourage the students to include their work in their portfolios as they look for jobs after graduation! Each and every one of them would make for an excellent hire – smart, resourceful, hard-working – and they know how to deliver results.
Congratulations Big Data MBA class of 2018!
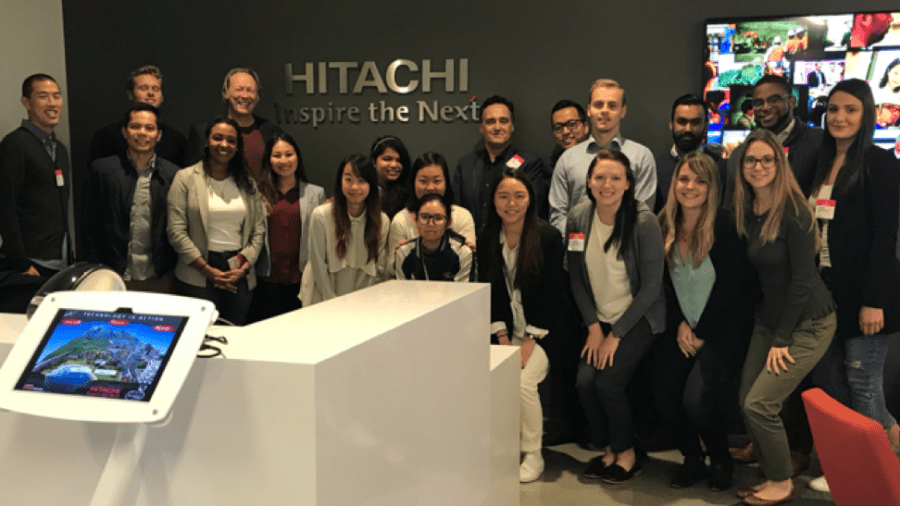
Members of the University of San Francisco 2018 Big Data MBA Class: Kavleen Batra, Chotika Chansereewat, Philip Chukwueke, Soumil Milan Doshi, Richard Fianza, Meredith Hursh, Mary-Ann Kubal, Colin Lau, Kelly Menold, Robert Mills, Hao Nguyen, Sahar Padash, Poranas Promsookt, Monica Rin, Lauren Ross, Felix Ruess, Mimoza Selmani, Hewotte Theodros, Thuy Tran, Minh Vu.