
A schema is a conceptual framework. It can function as a lens through which to study data. When I was conducting research on workplace stress to do my graduate degree, I did so through the critical lens of social disablement. I applied a hierarchical schema to study stress constructed from prominent themes in social disablement. I associated stress with the loss of personal autonomy in the workplace. There was little doubt in my mind that I had chosen a highly “academic” focus for my research. However, a schema doesn’t have to be something esoteric discussed among social researchers. In this blog, I consider the use of a schema for analytics.
Below I present a schema that can hold the types of data that an analyst might encounter handling quality control and performance analytics at a call centre. (Coincidentally this is what I do for a living.) Much depends on the exact role of the analyst. Myself, I study changing developments in the market; the performance behaviours of employees; the quality of their work; the extent to which employees conform to operating standards; and the contexts in which production occurs. I believe that much the same types of data can be found in other production-oriented organizations including companies in retail and manufacturing.
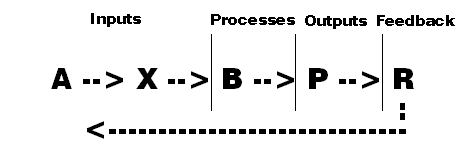
In the schema, processes at A lead to X; X to B; B to P; and P to R. I will elaborate on the meaning of these symbols in a moment.
Given the progression from A to R, some might suggest the following about the schema as it relates to systems theory: data pertaining to inputs at A and X lead to processes at B giving rise to outputs at P followed by feedback at R.
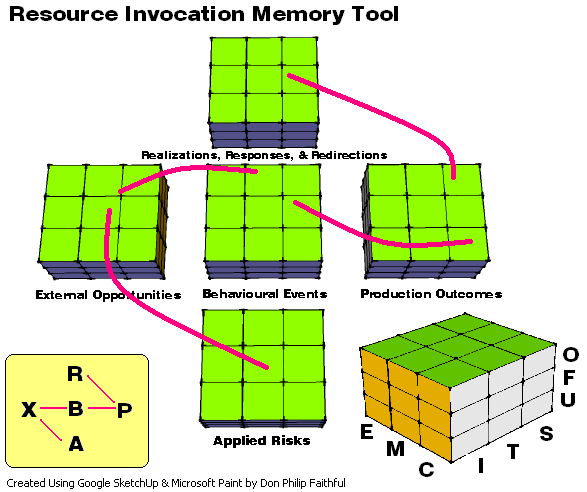
Each block generates data that can be described using the symbols E, M, C, I, T, S, U, F, and O. I can provide headers for the symbols – as listed below. In future blogs, I can also offer a detailed explanation of each symbol – assuming the community has an interest in the details. (I am not promoting a specific schema but rather the general use of schemas for analytics.)
Symbols for Placement (Using My 5-Block Schema)
A = applied risks
X = external opportunities
B = behavioural events
P = production outcomes
R = realizations, responses, and redirections
Aspect Symbols
I = intermedial; T = technical; S = sectional
U = unitizing; F = flowing; O = organizing
E = extension; M = market; C = control
Potential Directions for Analysis
Consider the idea of obtaining data from client feedback (Q) – and determining the placement for this feedback on my 5-block schema. Feedback might be reasonably received in relation to X, B, P, and R. The number of after-sale complaints as a percentage of items sold could be “placed” as follows: (Q @ R)/(items sold @ P). The number of agent-interaction complaints as a percentage of time spent selling could be placed as (Q @ B) / (time spent selling @ B). The number of delivery complaints as a percentage of items shipped might be placed as (Q @ P) / (items shipped @ P). (Another block could be created beyond P if the organization has quite an elaborate fulfilment process. I suggest a sixth block could be called F (fulfilment.)
Why bother using schematic symbols rather than simple field names? Something like “items sold @ P” is merely one item at P. One of the benefits of characterizing data by schema is the ability to analyze through abstraction – i.e. through the schema itself. Below I list some possibilities – all ignoring the specific fields that might be contained within the placement symbols.
Examining Efficiency (Input/Output): A/X, X/P, A/P, B/P, X/R, A/R, B/R, and P/R
Examining Efficacy (Output/Input): X/A, P/X, P/A, P/B, R/X, R/A, R/B, and R/P
Consequently, “items sold @ P” could be compared to “time spent selling @ B” – or P/B indicated above as a measurement of efficiency – assuming the fields have been properly positioned on the schema. Without necessarily sharing any of the underlying data or data field names, it is possible to exchange, compare, and adopt different schemas; this could be done to ascertain which schemas or abstract metrics seem to be most effective for increasing business.
Integrating Schematics with Data Logistics
I use standardized logistics for data at U, F, and O. Period journals or templates incorporate data from a reporting system to give a snapshot usually on a particular day. Data at this level of development is associated with U (unitizing). Depending on the situation, the data undergoes either extraction or conversion. Extraction data normally goes into perpetual databases. Conversion data tends to go into primary databases. At this level of development, the data is considered F (flowing). Any time period of primary data (any construction, deconstruction, or other form of thematic selection) normally gets placed on a secondary database where inserts and charts are generated for presentation purposes. Mass data lines on the secondary databases go into one or more tertiary databases. Data at this level and beyond would be described as O (organizing).
It is within the context of U, F, and O where one attempts, through the use of analytical phenomenology (my use of the term), to ascertain how phenomena in the organization give rise to quantitative developments across different places, spaces, time periods, and constructs. A particular type of analytical phenomenology of interest to me relates to the individual employee. In order to study individual influences and effects, it is necessary to deconstruct data to its intermedial level (that is to say, at the level of the intermediaries – I). It is then possible to examine how individuals and groups might affect different individuals, groups, processes, and outcomes at other stages in the operation.
Somebody in quality control would be mired if many errors and oversights occur during production. Don @ R might become incapacitated if errors jump dramatically @ B and @ P. Using the schema, it would be possible to pinpoint which individuals at @ B and @ P appear to be associated with adverse fluctuations in quality. With this level of attribution, it would also be possible to implement targeted behavioural conditioning and monitor quantitative phenomenological expressions – that is to say, unique individual responses to performance control initiatives.
I believe that the idea of “organization development” is premised on the ability of the organization to confirm that development has occurred; for this reason, the development of an organization seems unlikely to exceed its ability to make such confirmations. Stated differently, the ability to confirm should normally precede change initiatives in order to ensure proper execution. An elaborate schema allows for the development of a structured system of control capable of detecting progress throughout production and ascertaining circumstances affecting individuals associated with operational difficulties.
I have come to realize over many years of studying performance analytics that an institutional one-size-fits-all perspective doesn’t necessarily bring out the best in people. I am not referring to their personalities but rather their productivity. I feel that one of the biggest threats to improvements in productivity is imprecision. A schematic framework allows for greater context to be retained by the data system. When I use the term “control,” I do not mean more control in terms of magnitude – this having little to do with control – but rather precision, meaningfulness, and thoughtfulness of application. Productive change is based on great knowledge of people, settings, situations, and circumstances. Using a schema therefore provides a means to “control control” (to control one’s use of control) – in a manner that is intimately connected to the phenomenal expressions of the underlying contributors of production.