
The Economic Value Curve is a measure of the relationship between a dependent variable and independent variables to achieve a particular outcome such as retain customers, increase operational uptime, or optimize inventory. The Economic Value Curve measures the impact that increasing or decreasing one of the independent variables has on the dependent variable. In Figure 1, for example, if we want to improve the dependent variable “Uptime %” then we need to spend more on the independent variable “Maintenance Spend”.
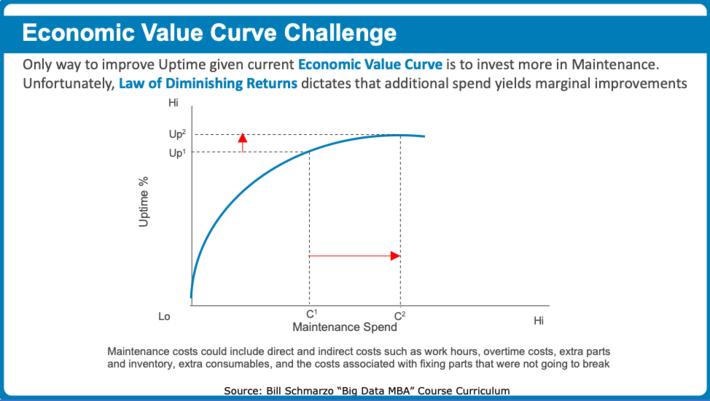
The challenge with the Economic Value Curve is the Law of Diminishing Returns. The Law of Diminishing Returns is a measure of the decrease in the marginal (incremental) output of a production process as the amount of a single factor of production is incrementally increased, while the amounts of all other factors of production stay constant. That is, at some point the more you spend (like Maintenance Spend in Figure 1), the less you are getting for that spend (like Uptime % in Figure 1).
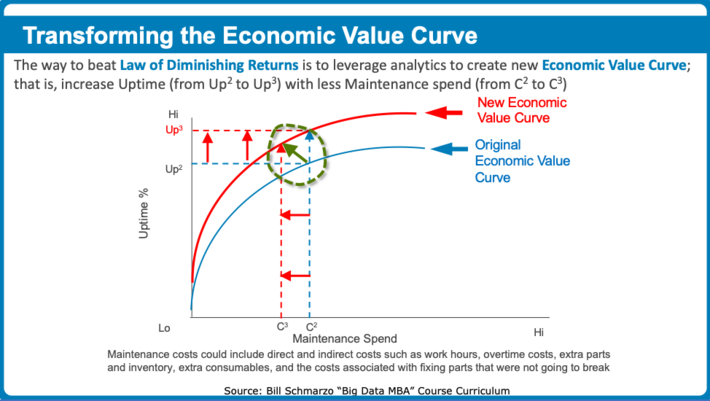
Transforming one’s Economic Value Curve is an area ripe for Analytics-driven Innovation and the opportunity to leverage analytics to “Do more with less” to transform one’s economic value curve. In Figure 2, that is highlighted by the green circle where we have leveraged analytics to increase the Uptime % while decreasing maintenance spend. Nice!
Now Figure 2 only deals with one independent variable. The interesting aspect of the Economic Value Curve is that the more dimensions or variables against which you have to optimize, the more creative and innovative your analytic-driven solutions are going to have to be.
For example, consider these scenarios:
- Increasing operational uptime while reducing maintenance costs while improving customer satisfaction, or better yet…
- Increasing operational uptime while reducing maintenance costs while improving customer satisfaction while reducing carbon footprint and emissions, or better yet…
- Increasing operational uptime while reducing maintenance costs while improving customer satisfaction while reducing carbon footprint and emissions while increasing employee job satisfaction.
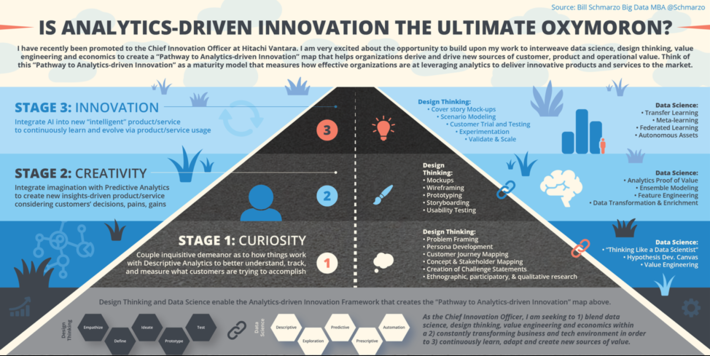
Yes, conflict is the source of innovation! See my latest blog “Is Analytics-driven Innovation the Ultimate Oxymoron?” for more information on the power of conflict to drive innovation.
Power of Analytics to Transform Your Economic Value Curve
Direct Marketing and Loyalty Card organizations have known for years the power of lift (since they have data at the level of the individual customer transaction). Lift is the percent increase or decrease in a particular metric (orders, purchases, returns, engagements, conversion) for users who received a special treatment versus a control group.
Lift can be achieved when organizations have access to individually-identifiable purchase and engagement data. And as more companies are getting access to individually-identifiable purchase and engagement transactions (Thank you, Big Data), these companies are realizing that it isn’t the volume of data that one monetizes, it’s the granularity. And that’s where Analytic Profiles and Digital Twins come into play (see Figure 3).
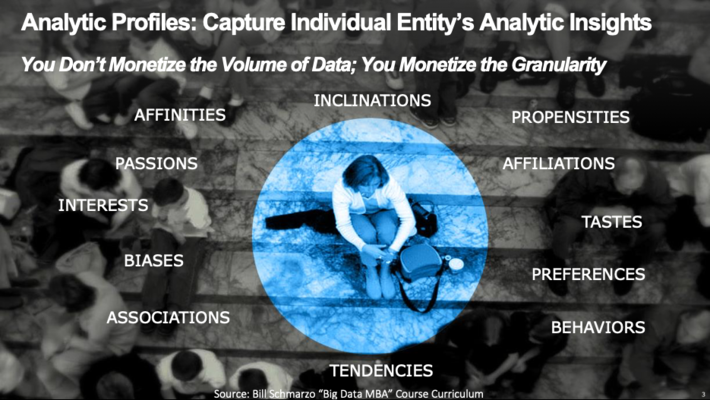
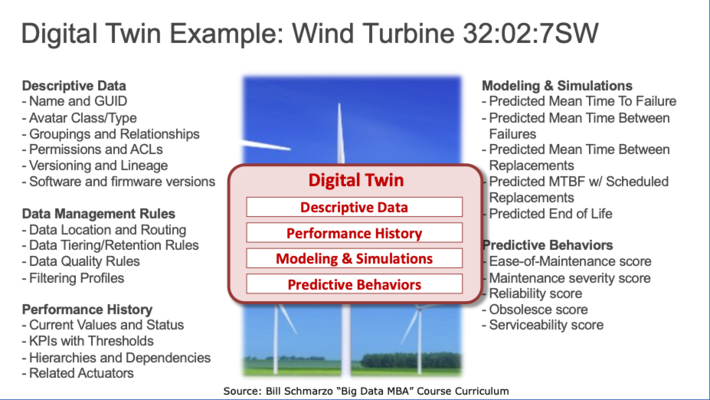
Analytic Profiles are an asset model for capturing analytic insights about the organization’s most important assets in a way that facilities the refinement and sharing of those analytic insights across multiple business or operational use cases. An Analytic Profile consists of metrics, predictive indicators, segments, scores, and business rules that codify the behaviors, preferences, propensities, inclinations, tendencies, interests, associations and affiliations for the organization’s key business entities such as customers, patients, students, athletes, jet engines, cars, locomotives, CAT scanners, and wind turbines (see Figure 4).
See “Analytics Profiles: Key to Data Monetization” for more details on how to leverage analytic profiles and digital twins to drive monetization opportunities.
In another example of leveraging analytics, big data and analytic profiles, we worked with one of our clients’ to predict each individual customer’s likely spend over the next 12 months. We then segmented the customers based upon that predicted spend. As you can see from Figure 5 that when segmented this way, the top 5 deciles account for 90% of total predicted sales.
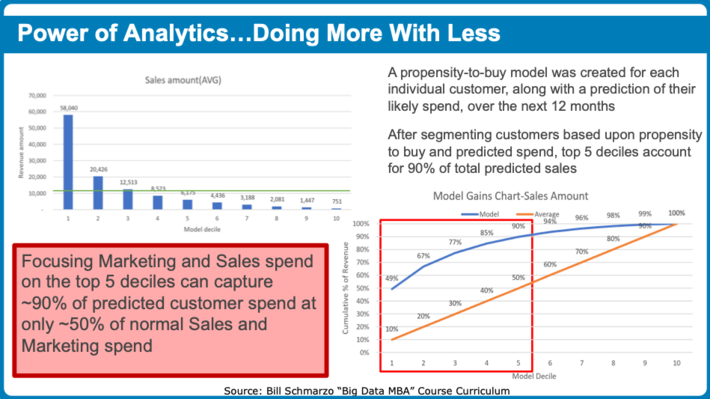
Focusing Marketing and Sales spend on the top 5 deciles can capture 90% of predicted customer spend at only 50% of normal Sales and Marketing spend. That’s the power of granular data and advanced analytics to transform one’s economic value curve!
Summary: Analytics to Transform Your Economic Value Curve
Economics is still the most powerful factor in business, and leading organizations are learning to leverage granular data with advanced analytics to transform their economic value curve. These organizations are embracing – not avoiding – conflict and diversity of perspectives to create potentially conflicting metrics against which to try to optimize performance that ultimately drives the innovation processes within organizations.
If you’re embracing innovation but not transforming one’s economic value curve…then why bother?