
By
- Priya Sharma – Sr. Data Scientist -IoT Analytics, SAS Institute Inc.
- Saurabh Mishra – Product Management, IoT, SAS Institute Inc.
June 12, 2020
Description: Majority of AI approaches are based on the construct of training against historical data and then inferencing new data. While this is a sound and proven approach, a lot of IoT assets coming online don’t have historical data and we don’t necessarily have the time to wait.
Modern Machine Learning methods can be employed to understand the behavior of newly connected IoT assets as soon as they are connected. This allows organizations to begin “condition-based monitoring” for these assets while they collect enough historical data to begin creating predictive models. Condition based monitoring can be used to support use cases such as early detection of performance degradation, emerging safety issues etc. which are especially relevant in Industrial IoT.
Introduction
Although we may be talking about billions of connected devices and hundreds of IoT platforms, the reality remains that only a small percentage of Industrial assets are connected. According to McKinsey, only 15% of industrial assets in production environment are connected. Now this number is increasing for sure but the data being collected from these newly connected assets is limited or non-existent.
The other reality to consider is the fact that most common AI models (especially deep learning) are strongly dependent on good training data. One can argue that the most important events that need to be modeled are failure events and for sectors like manufacturing where six sigma practices have been widely implemented, most organizations strive to have fewer than 3-4 defects per million parts. The rarity of these defects makes it challenging to train models.
These two realities could present a grim picture of the extent of operationalization of AI in Industrial environments. However, there is a middle ground. In this article, we will talk about Machine Learning approaches that do not require historical data and application scenarios. The focus use case for this article is Condition Based Monitoring (CBM) in an Industrial IoT setting.
CBM can provide timely intervention which can significantly increase the lifetime and operational efficiency of high valued assets. It can be the first step to get meaningful analytics on vast amount of data generated across supply chains and support AI based models to derive value from the data and add analytical maturity.
Machine Learning Approaches
There are several Machine Learning approaches that can be used in-stream against IoT data that does not need historical data. These methods can range from simple techniques such as Lag monitoring to more complex ones like Subspace Tracking.
Following are a few of these methods that are supported in SAS Event Stream Processing along with applicable scenarios.
- Lag monitoring – The lag monitoring algorithm computes the cross-correlation between a target time series and one or more additional time series. Results contain the selected lags and computed cross-correlation values that correspond to minimum, maximum, and maximum absolute value cross-correlations for each of the variables. Lag monitoring could be applicable in an assembly line scenario, where downstream events typically lag upstream events by a fixed time. Changes in this could indicate an anomaly.
- Moving Relative Range (MRR) – MRR provides a measure of volatility for a nonstationary time series, where the mean and the variance of the series change over time. For example, you could use MRR to detect electrical disturbances in the power grid caused by equipment failures and lightning strikes propagating through the network.
- Change Detection – With change detection, a stream of measures is monitored, and an alert is raised when values deviate from what is expected. This algorithm can be used for real-world acoustic event detection for surveillance or multimedia information retrieval.
- Streaming K-Means Clustering – K-Means clustering is an iterative algorithm that partitions data into non-overlapping groups based on their similarity. You can use it to discover hidden structures within the data and to detect outliers. Common uses include market segmentation, image segmentation, and image compression.
- Streaming DBSCAN Clustering – DBSCAN clustering is an unsupervised learning method to distinguish clusters of high density from clusters of low density. You can use DBSCAN clustering to cluster location data in order to identify where particular events occur.
- Short-Term Fourier Transform (STFT) – STFT is commonly used to monitor the time-varying frequency content of a signal. This monitoring can enable early detection of machine faults and thus lead to more efficient machine maintenance. It has been applied widely in various time series analysis including speech, audio, machine vibration, EKG and EEG signal processing.
- Cepstrum – A cepstrum results from taking the inverse Fourier transform of the logarithm of the estimated spectrum of a signal. It can be used to find out whether a signal contains periodic elements in seismic, speech, and radar signal processing. This method is very effective in digital speech processing to detect the pitch in the human speech signal and extract the transfer function of the vocal tract in voiced speech.
- Subspace Tracking (SST) – SST method is used to detect anomalies and degradation in systems that generate high-frequency, high-dimensional data. It is frequently used in the IoT world where data is gathered from many sensors that are connected to each other and have high correlation. This approach converts a set of correlated variables to a set of linearly uncorrelated variables known as principal components and tracks principal subspace over time. Because the first few principal components usually capture most of the variability in the data, they can be tracked over time to assess whether any changes have taken place in the subspace that is spanned by the data. It is very effective with rare events. It can monitor floodlight systems to identify and alert on faulty lights, detect defective panels in solar farms,
and monitor degradation in wind turbines.
Let’s see an example use case to detect anomalies in floodlights using Subspace Tracking method.
The data consists of energy consumption (kW) values captured every five minutes from six floodlight circuits in a smart campus over a span of three months. SST can detect malfunctioning circuits in the floodlights by tracking angle changes between principal components or by using principal component distances away from the mean.
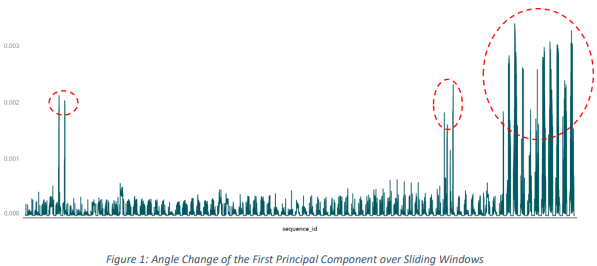
Figure 1 above displays the angle change of the first principal component between consecutive
windows.
- Value of angle change, indicated as vertical spikes in figure 1, is relatively higher when an outlier
enters or exits the window - Checking value of angle change can detect when a light circuit is not functioning properly
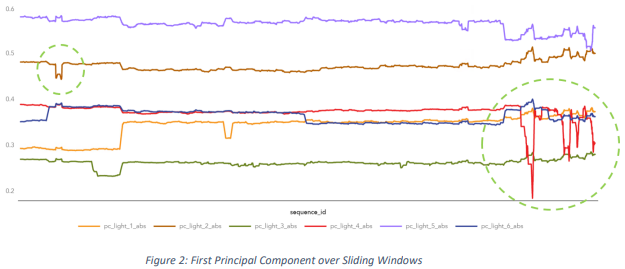
Figure 2 above can help determine which floodlight circuits are malfunctioning by comparing first
principal component over sliding windows. SST can give you a relatively clear indication of which part of
the system is getting out of control.
- Light 2 starts deviating from the first principal components that are associated with the other lights around sixth night for these lights but goes back to normal operations.
- Light 4 starts deviating from the first principal components that are associated with the other lights around the same time the spikes in angle changes were observed towards the end.
The real-time alerts can trigger maintenance activities to replace the faulty circuit to return it to normal operations. More details on the example are available on SAS Software’s GitHub under “Anomaly Detection in Floodlights for Smart Campus”.
Subspace tracking and other methods discussed above can be used in new IoT enabled asset without the need of historical data to gain insights and detect anomalies for Condition-Based Monitoring.
Conclusion
In a recent MAPI survey, 58% of research respondents reported that the most significant barrier to deployment of AI solutions pertained to a lack of data resources. However, organizations don’t necessarily have to wait to start on their Industrial IoT roadmap. There is immediate value to be had with the approaches described above while these challenges are overcome.
Original document: here