
This article was written by Jean-Nicholas Hould. For the last six years, Jean-Nicholas has been working professionally in the field of data science. During those years, he has been doing lots of data engineering, analysis and statistics.
I recently came across a paper named Tidy Data by Hadley Wickham. Published back in 2014, the paper focuses on one aspect of cleaning up data, tidying data: structuring datasets to facilitate analysis. Through the paper, Wickham demonstrates how any dataset can be structured in a standardized way prior to analysis. He presents in detail the different types of data sets and how to wrangle them into a standard format.
As a data scientist, I think you should get very familiar with this standardized structure of a dataset. Data cleaning is one the most frequent task in data science. No matter what kind of data you are dealing with or what kind of analysis you are performing, you will have to clean the data at some point. Tidying your data in a standard format makes things easier down the road. You can reuse a standard set of tools across your different analysis.
In this post, I will summarize some tidying examples Wickham uses in his paper and I will demonstrate how to do so using the Python pandas library.
Defining tidy data
The structure Wickham defines as tidy has the following attributes:
- Each variable forms a column and contains values
- Each observation forms a row
- Each type of observational unit forms a table
A few definitions:
- Variable: A measurement or an attribute. Height, weight, sex, etc.
- Value: The actual measurement or attribute. 152 cm, 80 kg, female, etc.
- Observation: All values measure on the same unit. Each person.
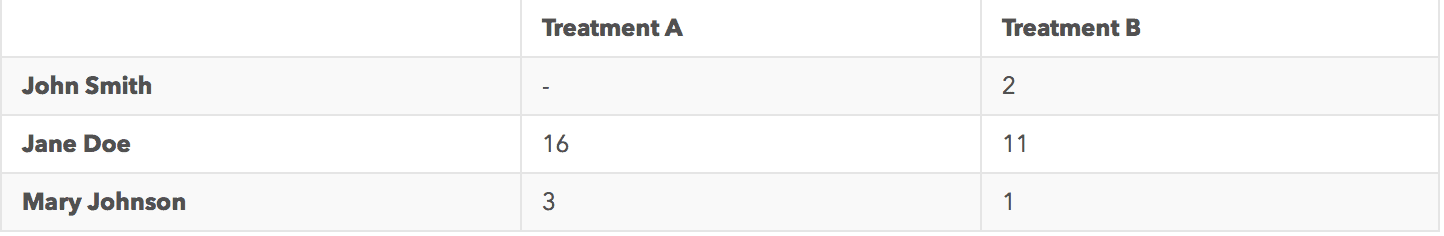
An example of a messy dataset:
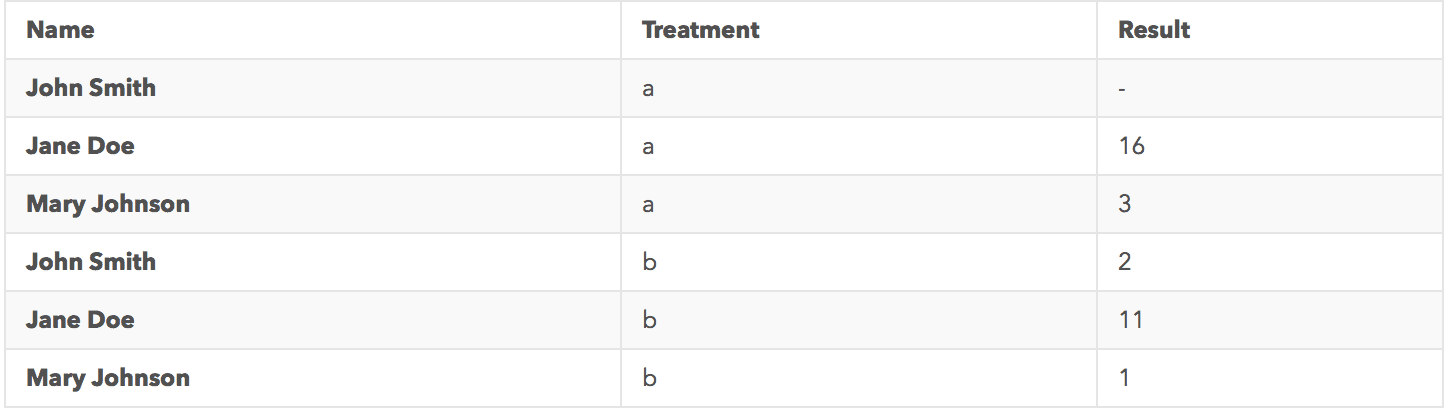
An example of a tidy dataset:
Tidying messy datasets
Through the following examples extracted from Wickham’s paper, we’ll wrangle messy datasets into the tidy format. The goal here is not to analyze the datasets but rather prepare them in a standardized way prior to the analysis. These are the five types of messy datasets we’ll tackle:
- Column headers are values, not variable names.
- Multiple variables are stored in one column.
- Variables are stored in both rows and columns.
- Multiple types of observational units are stored in the same table.
- A single observational unit is stored in multiple tables.
Note: All of the code presented in this post is available on Github.
To read more, click here.