
We live in a world where the amount of data has increased on a large scale in various fields. Websites track user activities, marketers collect the customer’s purchasing history, so-called “Quantified-Selfers” collect the user’s sleeping patterns and heart rates, and so on.
With the availability of vast amounts of data, most industries have started focusing on leveraging valuable insights from it. Those insights can give businesses a competitive advantage in the market and even early detection of certain diseases in the medical field. The way insights are unleashed from data is by a systematic analysis which involves various phases. But before stepping into that, let’s look back to understand from where this all started.
Back in the 1890s
The emergence of enormous data led to the question “How to effectively organise and manage big datasets”. One such data problem was the 1890s US census data, probably the first data problem in North America. To manage the US census data more effectively, an American inventor Herman Hollerith used punch cards which store the data for each person and designed a machine which can read back the data from punch card.
The success of Hollerith’s machine led to the establishment of his own company, The Tabulating Machine Company, which is merged with two other companies and later known as International Business Machines Corporation (IBM).
20th century
The 1935 Social Security Act launched by the US government under the administration of Franklin D. Roosevelt was one such enormous data gathering project. The winning contractor for the Social Security Act was IBM. IBM gathered the employment records of 23 million employees and stored the information in punch cards.
Later, in 1943 at Bletchley Park, a British facility responsible for deciphering Nazi code during World War II developed the first programmable electronic digital machine named Colossus. Although Colossus was designed for a specific cryptanalysis task, it provided reliable high-speed computations and thereby reduced the amount of time from weeks to hours.
Information Explosion
Before 1950, most of the challenges associated with data was about volume, until the US National Security Agency (NSA) recognised the second key component of Big data, which is velocity. During the cold war, cryptologists in the NSA struggled with massive information overload due to automated data collection.
In 1961, Derek Price described the exponential growth rate of scientific journals and papers in his publication ‘Science Since Babylon’. Price’s work highlighted the fact that big data is not just about volume but also about velocity.
In order to manage the increasing volume of data, Harry J. Gray and Henry Ruston came up with recommendations in their paper “Techniques for Coping with the Information Explosion in 1964”.
As an alternative to limiting the amount of data, B. A Marron and P.A.D. de Maine introduced Automatic data compression, a system which can automatically compress the data and decode it when it is required.
In 1974, the term “data science” was freely used by Peter Naur, a Danish computer scientist and Turing award winner, in his book titled Concise Survey of Computer Methods in Sweden and the United States. Naur defined data science as, “The science of dealing with data, once they have been established, while the relation of the data to what they represent is delegated to other fields and sciences.”
Following this, the International Association for Statistical Computing (IASC) was founded in 1977 to transform data in the form of knowledge and information by consolidating the traditional statistical methodology, computer technology, and domain expertise. Data science gained recognition in the industry gradually. The future significance of data science was recognised during the International Federation of Classification Societies (IFCS) conferences in 1996, in a conference titled ‘Data science, classification, and related methods’. Since the objective of the IFCS is to support the wide range of developments across classification and other related knowledge ordering, the usage of terms data analysis, data science, and data mining started appearing in their publications.
1997 was the year in which big data and data mining emerged. The journal Knowledge Discovery and Data Mining explored the theory, techniques and the relevant practices for extracting knowledge from large databases. In the same year, Michael Cox and David Ellsworth coined the term ’big data’ in their paper “Application-controlled demand paging for out-of-core visualisation”.
The introduction of Hadoop made a significant impact on the big data revolution and changed the dynamics and economics of large scale computing. Originally, Hadoop was developed for Nutch search engine project by Michael J. Cafarella and Doug Cutting. Eventually, Hadoop enabled the distributed processing of big data sets over clusters of servers with high fault tolerance.
Over the years, information technology has continually evolved. So the database technologies too. Like data warehouse technologies came in place and many others. We can say that these big data sets lead to the situation: data rich but information poor.
Now, what are Big Data, Data Science & Data mining?
Big Data
The following are some of the definitions of big data:
Doug Laney in 2001 described big data as being a
“3-dimensional data challenge of increasing data volume, velocity and variety.”
Later in 2010, Apache Hadoop defined big data as follows
“datasets which could not be captured, managed, and processed by general computers within an acceptable scope.”
Likewise, the TechAmerica Foundation defined big data as
“a term that describes large volumes of high velocity, complex and variable data that require advanced techniques and technologies to enable the capture, storage, distribution, management, and analysis of the information.”
The point here is that big data refers to massive complex datasets which are difficult to store, analyse and visualise for further processes or results. Big Data Analytics or Knowledge Discovery from Data (KDD) are operations designed to get insights and knowledge from big datasets. Enterprise data provides an example of big datasets which comprises data from various business functions, such as production, inventory, sales, finance and so on. The impact of performing analytics on big datasets can lead enterprises to data-driven activities and decision making. Another common example of big data can be found on the Internet of Things(IoT) paradigm. Data from various types of sensors results in big clusters of data.
As already stated, the characteristics of big data make it an extreme challenge for discovering useful insights. To get more intuition about the underlying problems in big data, consider the following perspective:
Imagine that a number of blind men are trying to examine a giant elephant – the elephant indicates big data in this context. The aim of each blind man is to draw a picture of the elephant based on the part they examined. As each person’s view is limited, their independent conclusions end up as biased decisions, such as a rope, wall, tree, or snake – as shown in the figure below:
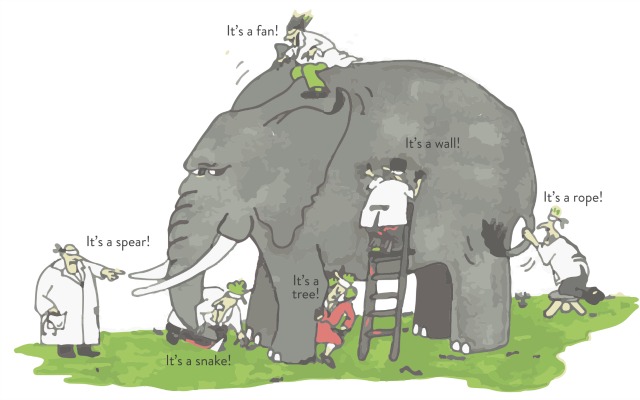
The blind men and the giant elephant: the localized (limited) view of each blind man leads to a biased conclusion.
In this case, to draw the best picture of the elephant, heterogeneous information from different sources (blind men) need to get aggregated.
The 3V’s of Big Data
The definition of big data pointed out the basic three characteristics of big data which are Volume, Velocity, and Variety.
- Volume points to the magnitude of data – many terabytes or petabytes.
- Velocity indicates the rate at which data are generated and how fast these generated data are processed.
- Variety specifies the structural heterogeneity of dataset. The data sets can be structured, semi-structured, and unstructured. The data in tabular form, which is seen in spreadsheets and in relational databases, are examples of structured data, whereas video, audio, text, and images are unstructured. An example of semi-structured data is Extensible Markup Language (XML).
Is there any benchmark for these characteristics? No.
And are these the only characteristics of the big dataset? Again the answer is no.
A universal benchmark for volume, variety, and velocity doesn’t exist as the limits for these characteristics varies upon size, sector as well as the location of the firm. Most importantly, the dimensions of big data are not independent of each other. That means a change in one dimension is likely to result in a change in another dimension as well.
In addition to the basic three Vs, three more dimensions have emerged. They are Veracity, Variability, and Value.
- Veracity: Veracity was coined by IBM, and represents quality, reliability, and uncertainty in data. For example, user sentiments in social media are uncertain in nature.
- Variability (and Complexity): Variability and Complexity are the other two dimensions of big data added by SAS. Variability denotes the change in the data flow rates. Most often, the velocity of big data is not consistent and has periodic peaks and troughs. Complexity points to the big data that is generated through numerous sources, which can be a critical challenge.
- Value: The value is considered as the defining attribute of big data, introduced by Oracle. The Value indicates the discovery of actionable knowledge. Often, the big data in its original form is considered as relatively “low-value density”. A higher value is obtained by analysing large volumes of such data.
Data Science
The term science denotes to systematic study for acquiring knowledge. Likewise, the term data science implies study for the generalisable extraction of knowledge from data. Provost and Fawcett (2013) described data science as
“a set of fundamental principles that support and guide the principled extraction of information and knowledge from data.”
As the definition says, data science is more about the key principles behind the data analytic process rather than relying on any specific algorithm or technique. Data science layout concise set of fundamental principles for the systematic and principled extraction of information and knowledge from data. Most often, data science overlap with Big data analytics. That means analysing big data sets involves the application of data science fundamental principles.
One of the familiar use cases of data science in the big data context is Amazon storing user searches. The saved user searches correlate to ‘what a particular user searches for’ with ‘what other users search for’ and by doing so, it outputs surprisingly appropriate recommendations. Another similar scenario is Google’s YouTube searches and recommendations. It’s not just Google and Amazon utilise the data effectively: many other companies including Facebook, Twitter and LinkedIn have recognised the potential impact of data analytics.
When it comes to the purpose of data science, we can say that it’s to improve decision making in a general sense. Such decision making often referred to as Data-driven decision making, a process of basing decisions on the basis of data analysis. In the case of Amazon searches, a computerized merchandising decision is an outcome.
There are several principles and concepts of data science which are well studied with both theoretical and empirical support. One of the fundamental concepts of data science mentioned by Provost and Fawcett (2013) is as follows: Careful consideration of the context should be taken while evaluating data science results. This concept points out that the applicability of decision suggested by results depends upon the business question. For Amazon recommendations, the evaluation of those recommendations should be done by asking related questions as follows:
- Does the recommendation lead to more sales than some other possible alternatives?
- How well would one recommendation have sold by chance?
Data science is a multidisciplinary field. Hence, data science includes techniques and theories drawn from many disciplines such as computer science, statistics along with domain expertise. To demonstrate the relationship of data science with other disciplines, an American data scientist Drew Conway constructed a Venn diagram as shown below.
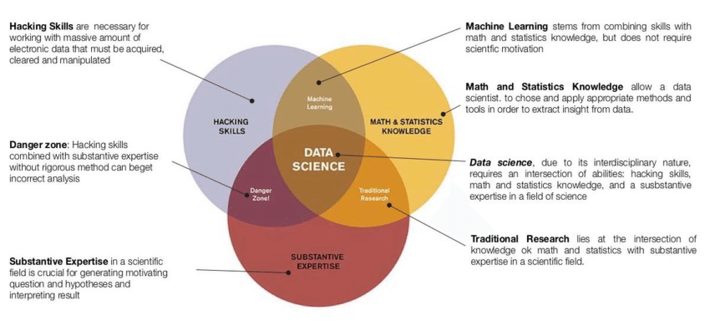
Data Science – Venn diagram
Data science lifecycle
Beyond this broadness in disciplines, data science involves various processes throughout an analytics lifecycle, often known as data science lifecycle.
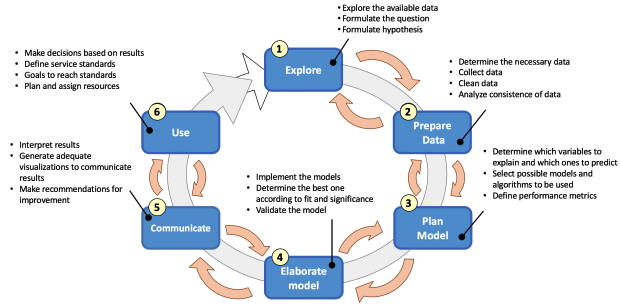
Data science lifecycle
We can say that the data science life cycle starts with a business problem to solve. It is very rare that the business problem having a direct correlation with the dataset. Therefore, we have to decompose the problem into subtasks. Starting with the exploration of data for a business problem, followed by preparing the dataset. The data preparation stage often involves data wrangling, a process of iterative data exploration and transformation that enables analysis. In other words, data wrangling is the process of improving the quality of data prior to the analysis.
Once the data is prepared, the next phase is to plan the model. At a high level, data modelling is a fundamental process that correlates the data to the solution of business problem. At the core, planning the model determines which algorithms and features to use in order to build the model. These algorithms can include statistics and machine learning methods.
Features are the basic building blocks of models which represent an individual property or attribute of a data set. We input features to model in order to generate the outcomes. Therefore, the quality of features has big impact on the quality of outcomes from the model. As a result, most data science projects incorporate a process known as feature engineering to improve the outcomes of the model. In feature engineering, the data gets aggregated to some sort of canonical form so-called features which better represent the underlying problem to the models.
The next phase is to elaborate the model which involves the implementation and validation of the model. The aim of this phase is to improve the accuracy of the results generated by the model. Afterward, the outcomes of the model need to get communicated effectively which involves generating visualisation of the findings. Finally, the model has to get deployed.
Throughout the data science lifecycle, the main point to take into consideration is that each phase within the data science lifecycle is equally important and should not be omitted when considering the application of data science methods to solve a business problem.
Data Mining
Many sources have mentioned the terms data mining and Knowledge Discovery from Data(KDD) interchangeably. While others view data mining as a subprocess of knowledge discovery from data. A commonly used definition of KDD by Fayyad et al. is as follows:
“The nontrivial process of identifying valid, novel, potentially useful, and ultimately understandable patterns in data.”
Being an essential step of KDD and also being viewed as an overall KDD process, data mining is defined as the process which involves “the discovery of interesting, unexpected, or valuable structures in large datasets”. The following diagram of the KDD process illustrates the data mining as being the subprocess of KDD. As you can see in this diagram, the input to this overall KDD process is data and the outcome is the knowledge. Consider the data consist of sales data of an organisation in previous years, then one of the useful knowledge which can be extracted from the data is the prediction of sales in the coming year.
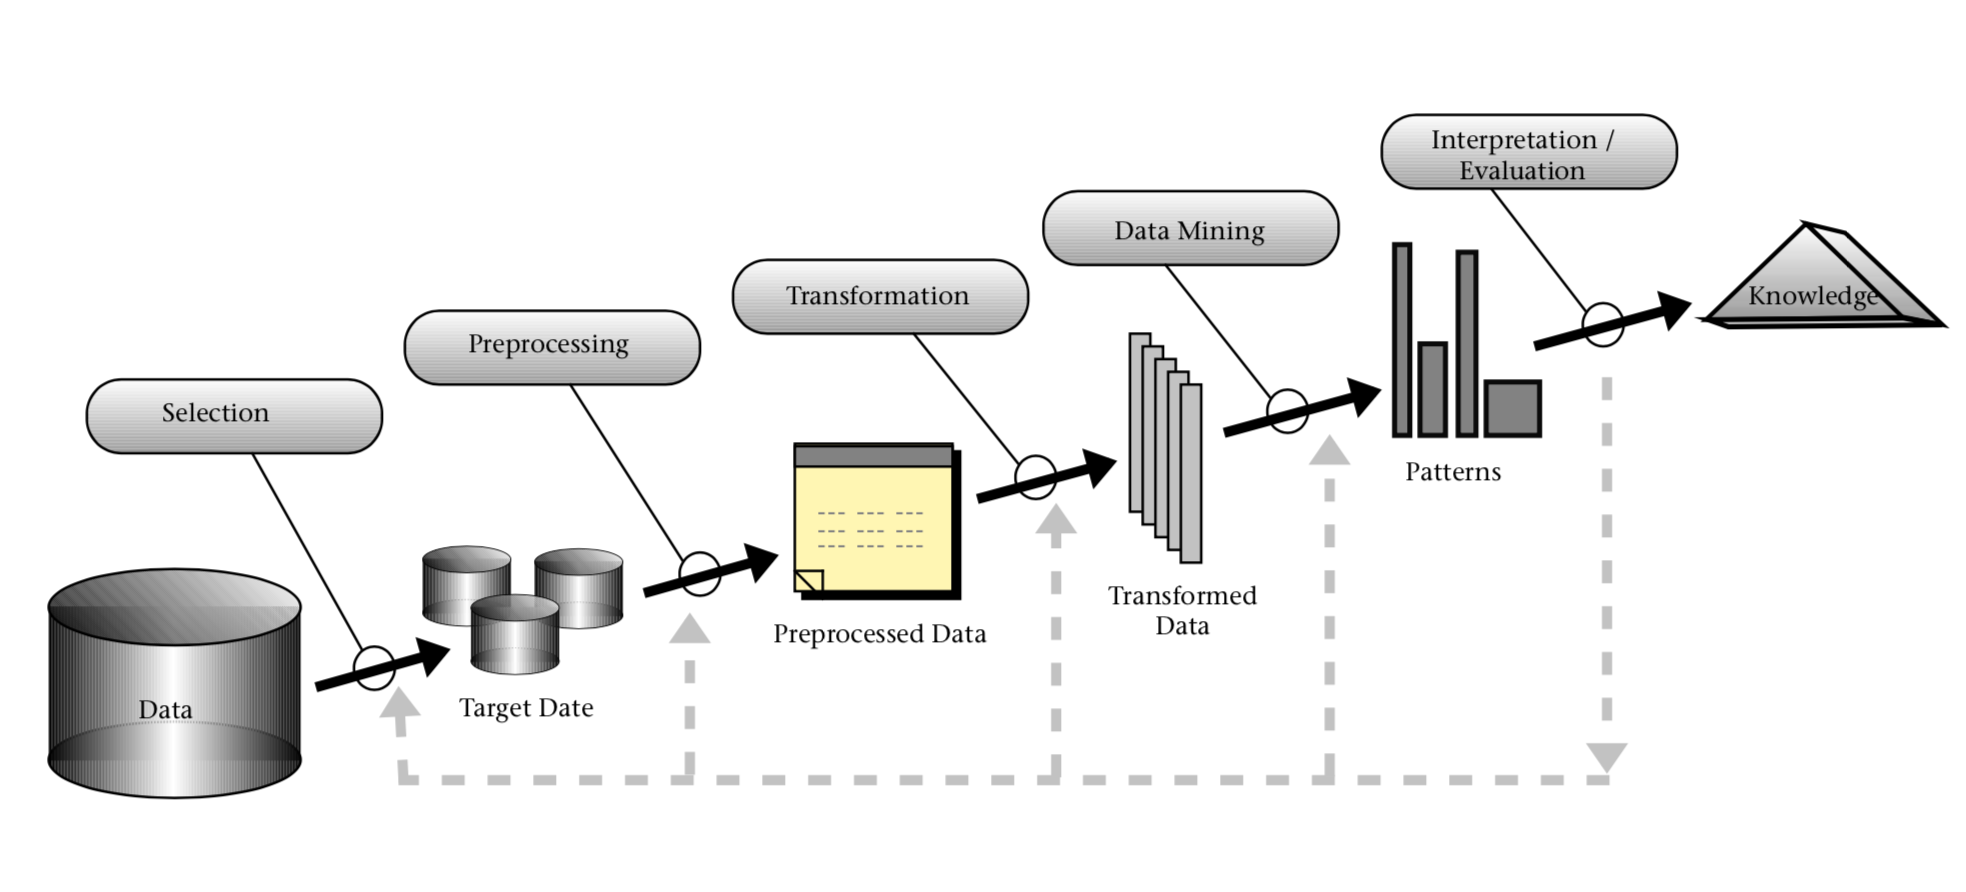
Knowledge Discovery from Data(KDD) Process
Prior to data mining, the raw data are subjected to pre-processing and once the data mining process has finished, the evaluation/interpretation of mining results has to be conducted. Followed by, the extracted knowledge should be clearly conveyed by visualisation.
When it comes to techniques and algorithms, data mining has its roots on machine learning and statistics. Therefore, we can say data mining overlap with machine learning and statistical methods. For example, Clustering is a machine learning method and also used as a data mining technique to group the data into categories.
The biggest confusion…
As being a data scientist for a while, I struggled to understand what actually data mining meant. I will say why. There are many posts and articles out there on the web which argue both data mining and data science are the same. Some say data science is a new buzzword for data mining. Like I mentioned before the terms data mining and knowledge discovery from data are used as synonyms in some places whereas some others view data mining as sub-process of KDD. Apart from KDD, there exist a few other terms that have a similar meaning to data mining which are: knowledge mining from data, knowledge extraction, data/pattern analysis, data archaeology, and data dredging.
Now you see the confusion…
After a bit of research about these topics, I would like to stick with the viewpoint mentioned by Wil M. P. van der Aalst in his book Process Mining: Data Science in Action. Data science can be seen as a new emerging discipline in recent years and Aalst proposed the definition of data science as follows:
“Data science is an interdisciplinary field aiming to turn data into real value. Data may be structured or unstructured, big or small, static or streaming. Value may be provided in the form of predictions, automated decisions, models learned from data, or any type of data visualization delivering insights. Data science includes data extraction, data preparation, data exploration, data transformation, storage and retrieval, computing infrastructures, various types of mining and learning, presentation of explanations and predictions, and the exploitation of results taking into account ethical, social, legal, and business aspects”
As the definition says, data science can be viewed as an amalgamation of classical disciplines like statistics, data mining, databases, and distributed systems. While data mining can be seen as an important part of data science discipline.
References
- Baldassarre, M., 2016. Think big: learning contexts, algorithms and…
- Bichler, M., Heinzl, A. and van der Aalst, W.M., 2017. Business ana…
- Chen, M., Mao, S. and Liu, Y., 2014. Big data: A survey. Mobile net…
- Coenen, F., 2011. Data mining: past, present and future. The Knowle…
- Dhar, V., 2012. Data science and prediction.
- Fayyad, U., Piatetsky-Shapiro, G. and Smyth, P., 1996. From data mi…
- Gandomi, A. and Haider, M., 2015. Beyond the hype: Big data concept…
- Han, J., Pei, J. and Kamber, M., 2011. Data mining: concepts and te…
- Provost, F. and Fawcett, T., 2013. Data science and its relationshi…
- Rodríguez, P., Palomino, N. and Mondaca, J., 2017. Using Big Data a…
- Song, I.Y. and Zhu, Y., 2016. Big data and data science: what shoul…
- Van Der Aalst, W., 2016. Data science in action. In Process Mining …
- White, T., 2012. Hadoop: The definitive guide. “ O’Reilly Media, In…
- Wu, X., Zhu, X., Wu, G.Q. and Ding, W., 2014. Data mining with big …
- Zarate Santovena, A., 2013. Big data: evolution, components, challe…
Copyright & License
Copyright © 2019 Arya Nalinkumar

The story of Big Data, Data Science & Data Mining by Arya Nalinkumar is licensed under a Creative Commons Attribution-NonCommercial 4.0 International License.
Originally published at https://arya-nk.github.io.