
I’m a big fan of Woody Allen’s earlier movies such as “Bananas”, “Sleeper” and especially the award winning “Annie Hall.” One of the things that always impressed me about Woody Allen was his ability to reframe the conversation in a way that was both provocative and creative. For example in the movie “Annie Hall”, there is a scene where Annie Hall (played by Diane Keaton) and Alvy Singer (played by Woody Allen) are sitting with their respective psychoanalysts when they are both asked the same question: “How often do you have sex?”
Alvy Singer replies: “Hardly ever, maybe 3 times a week”
Annie Hall replies: “Constantly, I’d say 3 times a week”

Source 1: “Annie Hall” Analyst Session
While reframing a conversation can be funny (at least in this scene from “Annie Hall”), reframing the problem or challenge can also uncover unique ways to create new sources of value. An example is the current debate reframing the role of starting pitching in Major League Baseball (MLB) and the way that reframing can uncover new sources of value. Let me explain further.
Reframing the Economics of Baseball Pitching
An article from the always provocative FiveThirtyEight.com titled “Forget Starting Pitchers. It’s Bullpen Season” raises a very provocative question: Do MLB teams really need “starting” pitchers” (which are very expensive) or can they more effectively spend their money in “opening” pitchers? From the article:
“Relievers accounted for a record 17,415⅓ innings this season, topping the record set last year of 16,469⅔ innings. Major league relievers accounted for 40.1 percent of total innings thrown this season, a record share of workload. And bullpens have taken on an even greater share of work in recent postseasons.” See Figure 2.
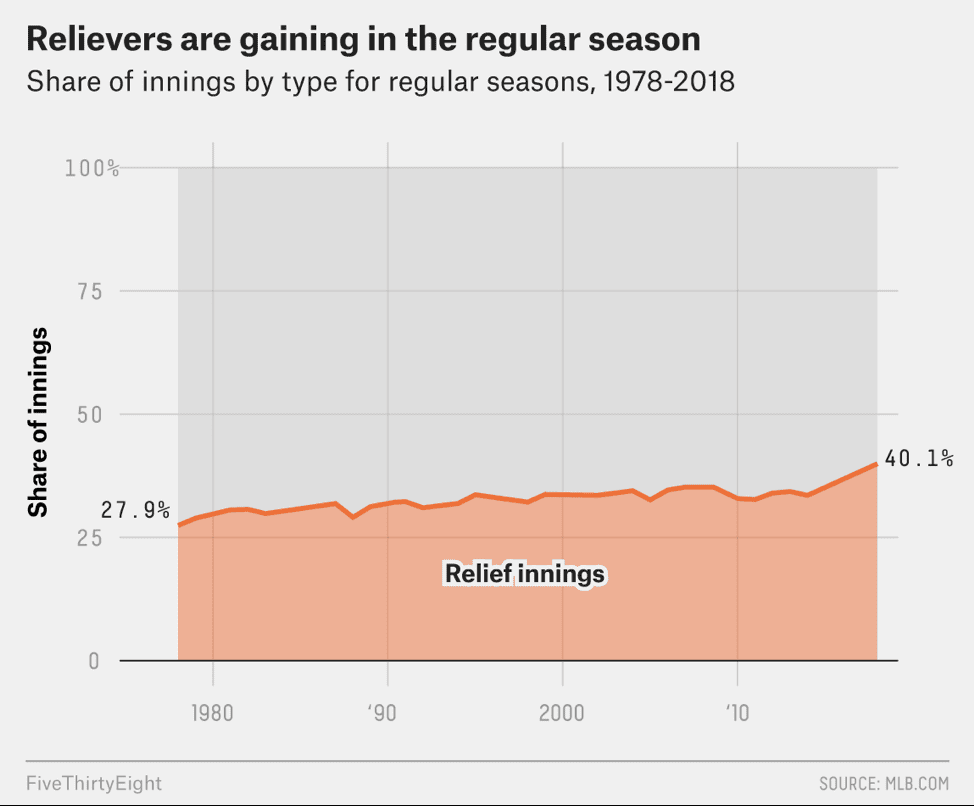
Figure 2: Percentage of Total Innings Pitched by Relief versus Starting Pitchers
What makes this conversation relevant is that Starting Pitchers are the highest paid positions in the MLB earning an average of $22.2M per year, while Relief Pitchers are the lowest-paid positions in the MLB making an average of $6.9M per year, or about 31% of the annual cost of a starting pitcher (see Figure 3).
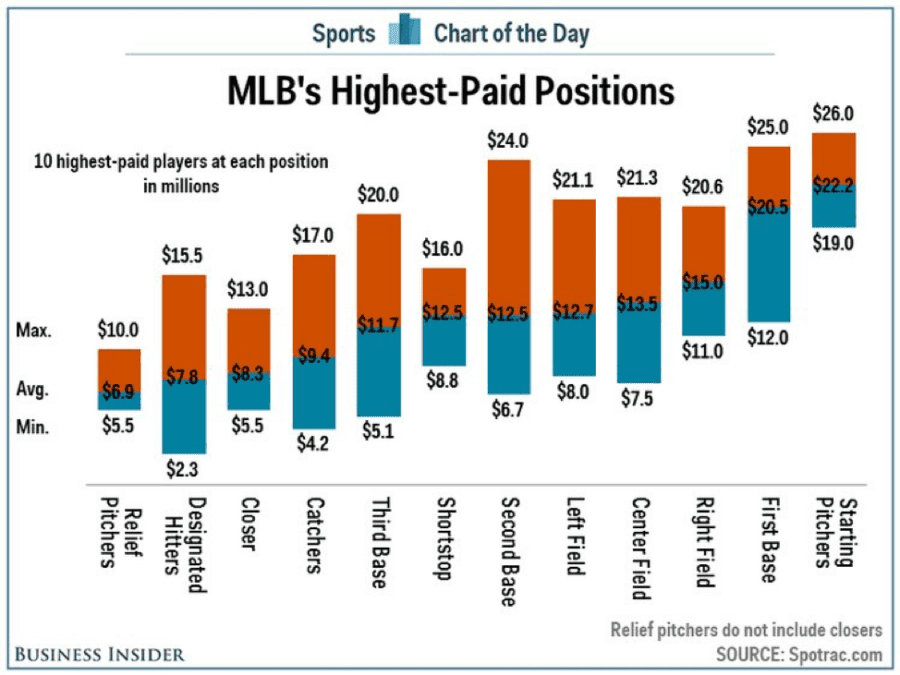
Figure 3: Major League Baseball Salary Ranges by Position
- Key Take-away: MLB teams are paying nearly 3x the cost for starting pitchers versus relief pitchers.
But wait, there’s more. The chart in Figure 4 shows the batter’s effectiveness – as measured by “On-base Percentage plus slugging” (OPS) – against starting pitchers versus relief pitchers in 2018 (up through September 27). In nearly every case from Figure 4, the OPS for starting pitching for the teams that made the playoffs (the best teams in baseball) increased as pitchers faced the same batter multiple times.
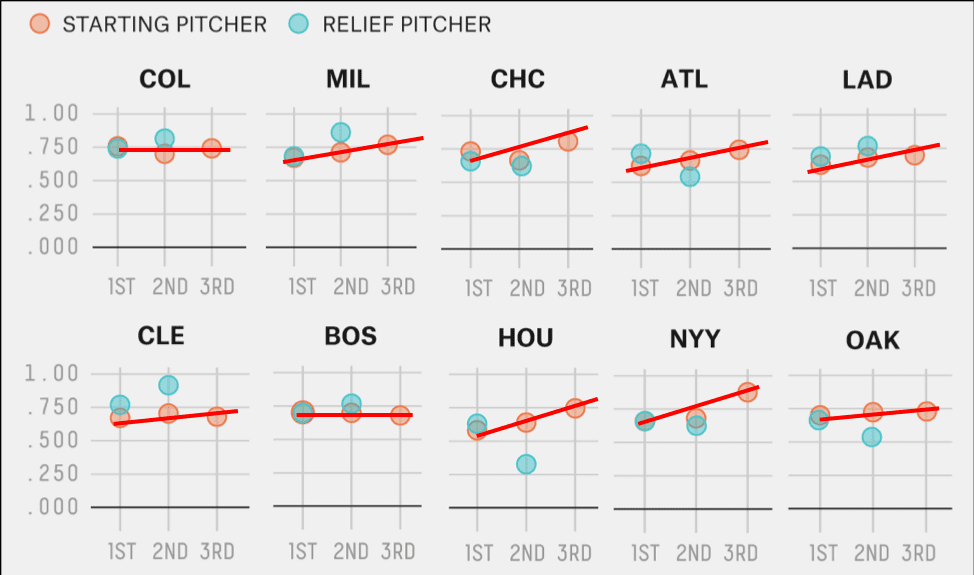
Figure 4: Batter OPS versus Starting and Relief Pitchers
Logically, this makes sense: the more times that a batter is able to face the same pitcher in the same game, the more effective the batter will become by understanding the pitcher’s mechanics, approach and pitch preferences. Figure 4 validates that.
- Key Take-away: it’s not the number of innings pitched that effect pitching performance; it’s the number of times a pitcher faces the same batters!
Starting Pitching Financial Assessment
So the questions now boils down to this: Are Starting Pitchers worth that 3x premium, or is there a better way to manage a pitching staff to achieve the same pitching results at a dramatically lower cost?
Let’s determine if starting pitchers are worth that 3x premium to relief pitchers by examining their respective Earned Run Average (ERA), which is a measure of pitcher effectiveness (the lower the ERA, the better the pitcher). From the table below, it is even more shocking to see that Relief pitchers have a better ERA than Starting Pitchers for each of the past 5 MLB seasons.
|
Season |
Starter ERA |
Relief ERA |
Difference |
% Difference |
|
2014 |
3.82 |
3.58 |
-0.24 |
-6.3% |
|
2015 |
4.10 |
3.71 |
-0.39 |
-9.5% |
|
2016 |
4.34 |
3.93 |
-0.41 |
-9.4% |
|
2017 |
4.49 |
4.15 |
-0.34 |
-7.6% |
|
2018 |
4.19 |
4.09 |
-0.10 |
-2.4% |
Source of data: Fan Graphs ERA Analysis Data
- Key Take-away: Relief pitchers over the past 5 seasons have had better performance than Starting Pitching as measured by Earned Runs Average (ERA) performance metric (they also been more effective in “Strikeouts per 9 Innings” and “Base-on-Balls per 9 Innings”).
Reframing and Economics Summary
Economics is the branch of knowledge concerned with the production, consumption, and transfer of wealth or value. And sometimes one needs to reframe the conversation in order to uncover new sources of wealth and value creation.
So to reframe the conversation, should baseball transition to “opening” pitchers (relievers that begin the game) instead of “starting” pitchers (who are pitchers who specialize in starting games) from an economics perspective?
The economics combined with the performance numbers indicate that maybe that’s the next key transformation in the sabermetrics dominated world of Major League Baseball.
“Momma, encourage your sons to grow up to be relievers.”
