
Huge amount data have been generated every day on various platforms such as Wikipedia, technical and non-technical blogs, social media, online news articles etc. Around five millions of articles are present in Wikipedia alone and every day thousands of new articles are added to it. Due to the huge amount data gathered every day, the users are bombarded with the large volume of data. For the human being, it is difficult to assimilate this huge amount of data. So, effective techniques are required to help the user to assimilate the data and make the data available for his use.

Fig. 1 User overloaded with information.
This research focuses on use of the text summarization and text sentiment analysis simultaneously on the text data. The summarization will reduce the amount of data and sentiment analysis helps the user to identify good, bad and other information in the documents. The summarization techniques produce a brief representation of the text and sentiment analysis will deduce the emotion expressed in the text. The BBC news articles related to sports are selected to demonstrate the research of document summarization and sentiment analysis. Basically, there are two types of summarization techniques: extractive and abstractive summarization. In the abstractive method, the semantic representation of the text is developed to produce a brief overview of the input text. The extraction method determines weightage of words, phrases, and sentences in the text. They produce the summary by selecting the most important words, sentence, and phrases from the text. In this research, the extractive summarization technique is applied on the BBC news articles as shown in figure 2.
Fig. 2 Text summarization.
Sentiment Analysis of News Documents
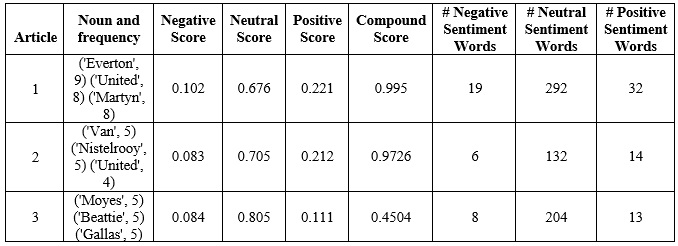
The sentiment analysis on the text document will make the user understand the emotional intend of the text. For a given text document, sentiment analysis can be carried out to word level, phrase level, sentence level or document level. The sentiment analyzer such as VADER produces the sentiment information such as positive, negative, neutral and compound score. It also gives the number of positive, the number of negative and number of neutral words in the text. BBC news documents are subjected to sentiment analysis using VADER and below table shows sentiment information for a few news articles. The frequency of noun occurrences in each BBC document is determined. The main topic of a BBC document is focused on the most frequent noun in that document. Various sentiment information collected using VADER has been displayed in the below table.
Summarization and Sentiment Analysis
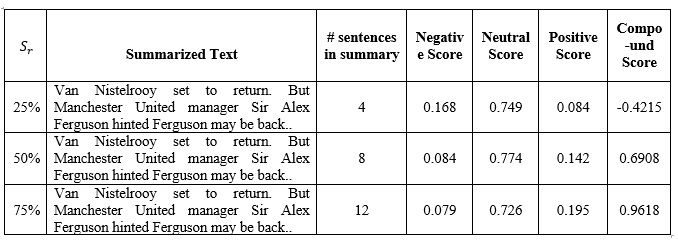
The text summarization gives a brief representation of the original text. The sentiment analysis can be applied after the document is summarized to a briefer version. The following table shows the sentiment scores when a news article is subjected to the summarization ratio of 25%, 50%, and 75%. The original BBC news article consists of 16 sentences and is reduced to the brief summary of 4 sentences, 8 sentences, and 12 sentences. The compound score for the original article is 0.9726 which reduced to 0.9618 for 75% summary and 0.6908 for 50% summary. As the ratio of summarization increases, the compound score reduces gradually.
 Twenty sport news articles are selected from BBC news from the category of football. For each article, a 3D column chart is produced using the noun with maximum frequency and sentiment information. The news article mainly focuses on the most occurring noun as the subject of topic discussion. The most occurring noun is depicted along the x-axis, along the y-axis the negative sentiment score and along the z-axis the positive sentiment score are shown. The 3D column chart highlights the sentiment scores such as positive and negative score with respect the subject of the article. Figure 3 shows the 3D column chart for articles related to football.
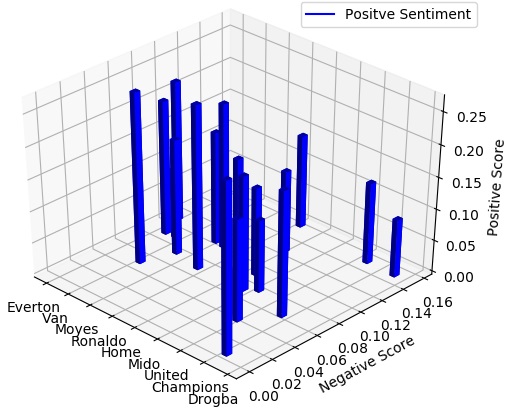
Figure 3. 3D column chart for football articles.
The 3D column chart further analyzed with the compound sentiment score and the number of noun occurrences in the article. Along the x-axis the noun with maximum frequency, along the y-axis the number of occurrences of that noun and along z-axis the compound score are depicted. Figure 4, shows the 3D column chart for the football articles and in this figure prime importance is given to compound score and the number of occurrences of the noun.
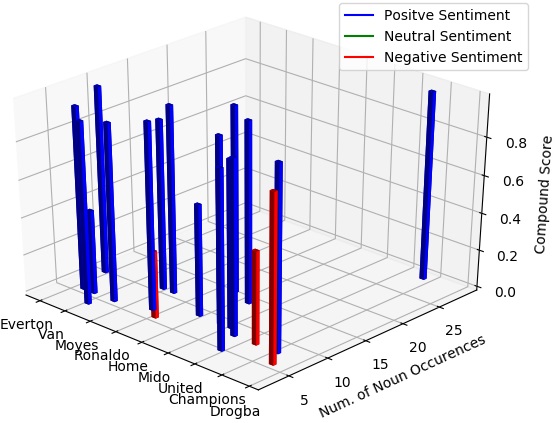 Figure 4. 3D column chart for football articles with the compound score.
The compound sentiment score for 20 football articles is represented in the 3-dimensional graph. In figure 5 the 3D compound score is shown for 20 football related articles. Along x-axis, the number of positive words, along y-axis the number of negative sentiment word and along the z-axis the compound score are shown. This graph reveals the variation in compound score in football articles.
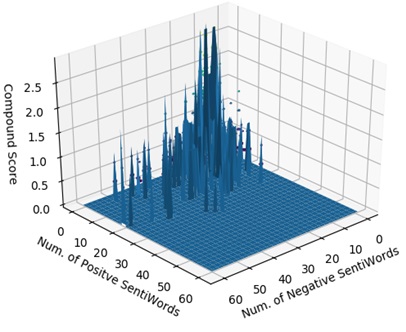
Figure 5. 3D surface for the compound sentiment score.
The 3D scatter plot for the sentiment of the news articles is produced. Figure 6 shows the 3D scatter plot for 20 football news articles. Each point in 3D space represents the number of negative sentiment words, the number of positive sentiment words and the number of neutral sentiment words. Moreover, based on the compound score the sentiment of the article is considered as positive (Blue) when the compound score is greater than zero, negative (Red) when the score is less than zero and neutral (Green) when the score is zero. This scatter plot shows the distribution of sentiment of the news articles.
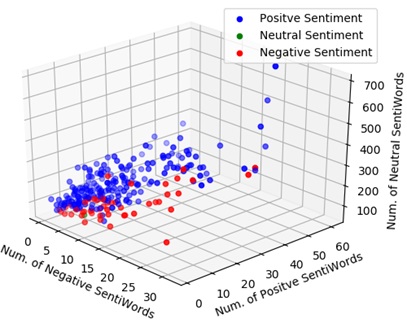
Figure 6. 3D scatter plot for football news articles.
Given a number of articles, the top ten words are selected with most positive and negative sentiments. Figure 7 shows the top ten positive sentiment words in 20 football articles. Figure 8 depicts the top ten negative sentiment words in those articles. Each word in the pie chart also shown with sentiment score along with its contribution to top ten words.
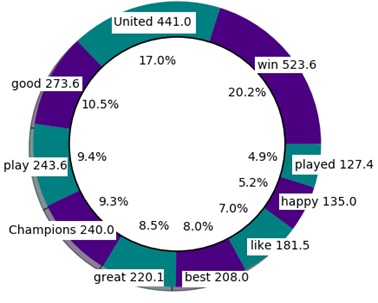 Figure 7. Top ten positive sentiment words.
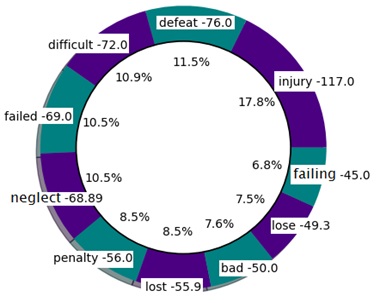 Figure 8. Top ten negative sentiment words.
Research Paper
The research on text summarization and sentiment visualization appeared in:
http://thesai.org/Publications/ViewPaper?Volume=9&Issue=8&C…
Cite the Work
Please cite the following research paper:
Siddhaling Urolagin, “Sentiment Analysis, Visualization and Classification of Summarized News Articles: A Novel Approach” in International Journal of Advanced Computer Science and Applications (IJACSA), Volume 9 Issue 8, pp. 616-625, August 2018.
Further Projects and Contact
For further reading and other projects please visit
Dr. Siddhaling Urolagin,
Department of Computer Science
BITS Pilani, Dubai Campus, Academic City
Dubai, United Arab Emirates