
In this article, I am going to show how to write python code that predicts the price of stock using Machine Learning technique that Long Short-Term Memory (LSTM).
Algorithm Selection
LSTM could not process a single data point. it needs a sequence of data for processing and able to store historical information. LSTM is an appropriate algorithm to make prediction and process based-on time-series data. It’s better to work on the regression problem.
The stock market has enormously historical data that varies with trade date, which is time-series data, but the LSTM model predicts future price of stock within a short-time period with higher accuracy when the dataset has a huge amount of data.
Data set
The historical stock price data set of Apple Inc was gathered from Yahoo! Financial web page. Which contains about stock prices from 2009–01–01 to 2020–04–20 with comma-separated value(.csv) format also it has a different type of price in a particular stock. By obtaining a data set, then come up with finalized characteristics and behavior of the stock prices. Seven features are obtained.
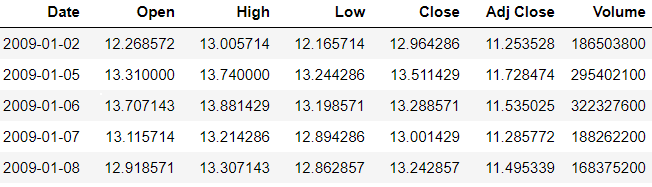
Description of each attribute
Describe the attribute of the data set given below. Attribute values are in floating point expect to date and volume.
Date: — Trading date of the stock.
Open: — This price of stock’s opening price which means the very beginning price of particular trading day, but which is not be the same price of precious’s day ending price.
High: — This is the highest price of the stock on a particular trading day.
Low: — This is the lowest stock price during trade day.
Close: — This is the closing price of the stock during trade-in particular day.
Adj Close: — This is the ending or closing price of the stock which was changed to contain any corporations’ actions and distribution that is occurred during trade time of the day.
Volume: — This is the number of stocks traded on a particular day.
Data pre-processing
The first stage we need to import all necessary libraries. The gathered data set was read using the panda library in python and display the records for understanding the data set for pre-processing. At this point, we able to identify the behaviors and characteristics of the data set.
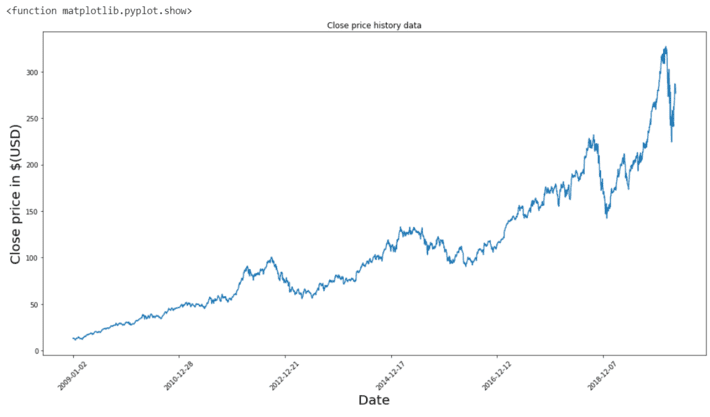
Visualizing given data into a plot graph format for growth and decrease behavior of stock prices. Besides only showing the changes in the closing price of the stock against that trading date. Other attributes are having stock prices, even though the close stock’s price is deciding the trading price of trading day. Matplotlib is the fabulous library in python for plotting any types of graphs.
Normalization
Feature scaling and normalizing data are the best way to reduce the error rate and improve the accuracy of the model. There are various types of data in a given data set. Here, I am putting all selected features on the same scale. Therefore, none of the features are dominating others. Below code, a snapshot is used to scale the data.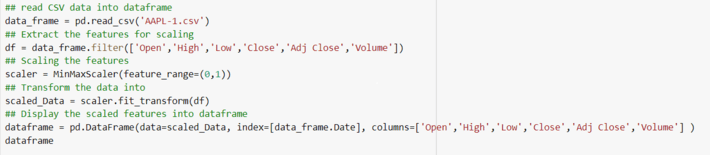 feature scaled data into tabular form. From this format, we could easily identify the trading rate of a particular rate. The feature scaling range should be between 0 and 1.
Visualization of Feature Distribution.
Below figure illustrates a visualization of the feature distribution. Through this graph, getting a better understanding of features and coefficient of the determination score. A heat map is created by over-index features. Here, we able to see the co-relation in between the given features of the data set such as Open, High, Low, Close and Adj Close. When we see at Volume point in heat map which is another feature but that does not show any correlation between other features. Therefore, it should be excluded in prediction.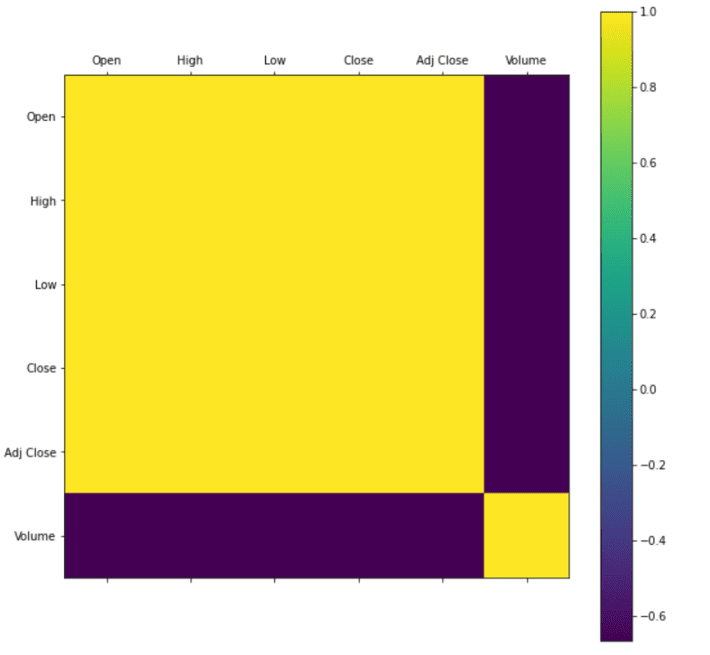 Extract the necessary feature, once it did then splitting data set into two parts training and testing. We never use the testing data for training. Below figure shows the code snapshot of splitting data for training.
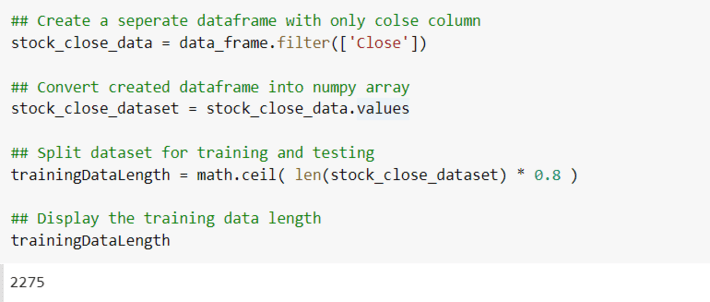 Here, I extract the ‘Close’ price of the given scaled data frame. I have been separated 80 percentage data for model training and 20 percentage data for testing. 2275 samples using for training out of 2843 samples, remaining for testing and validation.
Implementation of Algorithm
Once finish the pre-processing stage let us move on to the implementation of LSTM algorithm. Before moving on that, create a training data set that contains the past six days close price of stock then predicts the close price of stock at day sixty-one. Split the training data set into two parts Xtrain and Ytrain. Here, Xtrain dataset is an independent dataset and Ytrain data set is a dependent data set.
Convert the Xtrain and Ytrain data set into NumPy array because it will take for training the LSTM model. LSTM model has a 3-Dimensional data set [number of samples, time steps, features]. Therefore, we need to reshape the data from 2-Dimensional to 3-Dimensional. (NumPy array has 2-dimensional data). Below the code, snapshot illustrates a clear idea about reshaping the data set.
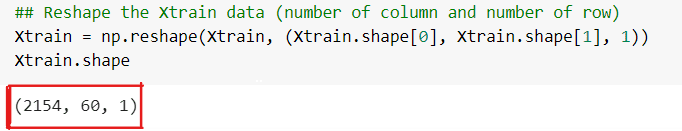 Create the LSTM model which has two LSTM layers that contain fifty neurons also it has 2 Dense layers that one layer contains twenty-five neurons and the other has one neuron. In order to create a model that sequential input of the LSTM model which creates by using Keras library on DNN (Deep Neural Network).
 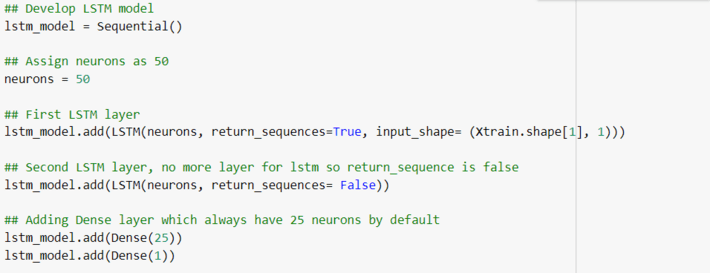 The compile LSTM model is using MSE (Mean Squared Error) for loss function and the optimizer to be the “adam”.
 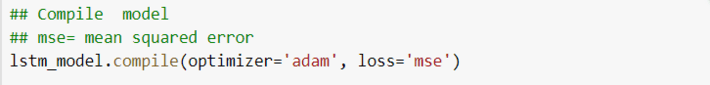 In order to train a LSTM model by using the created training data set. Here, fit the trained model with a batch- size that is a number of training examples that present a single batch, epochs are another parameter which means the number of iteration in the train model, if the epoch value is increasing then you will get the much accuracy of your model output.
 Testing
 Testing
In this testing stage, test the created model. Here, we are going to get the stock close price of the next day of Apple Inc. it will be 21–04–2020. (Training data set values contain between 2009–01–01 and 20–04–2020).
We have to create an empty array list and assigned the last sixty days close price data into it. Convert that array list into NumPy and again reshape the data. It will be the input data of the model.
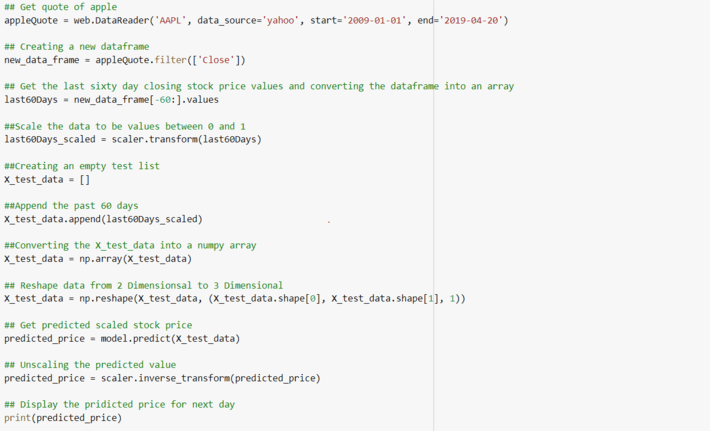 Get actual price of the stock at particular trading day from Yahoo Finance page directly.
Result and Discussion
 Result and Discussion
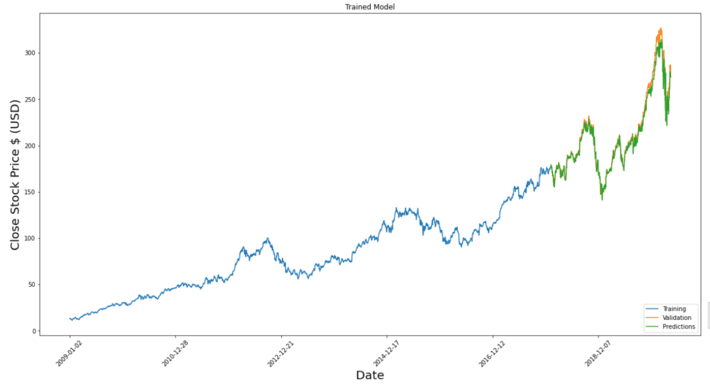 Above the plot graph shows the result of predicting stock price against the trading day. Here, validation and prediction are much the same. Obtained the error rate of the training model is specified as Root Mean Squared Error (RSME) which is 6.65%. it evaluates the prediction accuracy.
Conclusion
We should follow below strategies to increase the accuracy of the model in the Long-Short Term Memory (LSTM) algorithm.
- Allocating more time-series data for training and testing (80% and 20%). It is a very important strategy to get higher accuracy results.
- Feature Scaling and Normalizing data to represent the independent features into a fixed range. Here, I put all the features on the same scale.
- Identifying the most important features from the given data set before training. It would be increasing the accuracy of the model.
I hope every one get clear understanding of stock price prediction using machine learning. Here, I share my gits repository with you.
)