
Author: Jason Yip, Director, Data Engineering- Tredence Inc. and Databricks champion (https://credentials.databricks.com/5c008430-2e0c-44d9-a8ca-db307deae4a4)
The pandemic stirred up a global supply chain challenge that has yet to abate. Additionally, the recent political uncertainty in Europe has created further turmoil for Europeans and impacted the global supply chain. Retail/CPG companies need to react quickly before their competitors due to the limited supply of literally anything in the world to ensure business as usual. With the rise of cloud data warehouses like Snowflake and Databricks, many companies are looking into migrating their workload to the cloud. However, while these platforms can easily handle the data engineering and machine learning of big data, they are still modeled after the traditional Relational Management Database (RMDB).
Traditional RMDB is designed to answer domain-specific questions like consumer sales in the last quarter or the number of transactions per day. Modern systems tend to store data in column format to quickly make aggregates (say, the sum of sales). However, with data sitting in silos, decision-making is more difficult and often requires SMEs in each area to answer questions in each vertical.
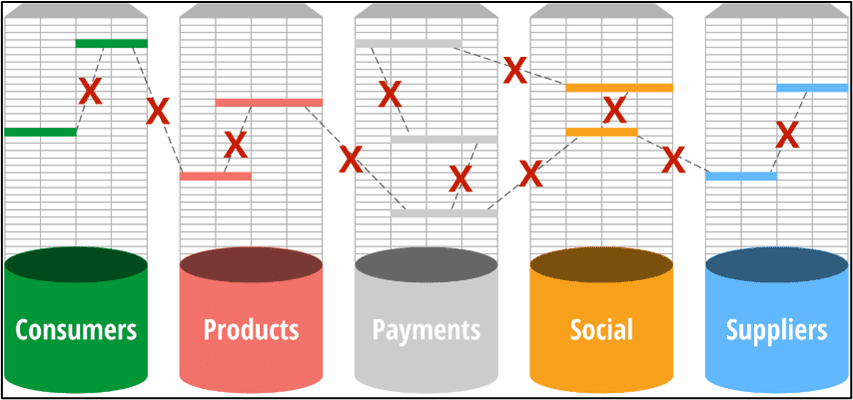
Source: https://neo4j.com/blog/retail-neo4j-personalized-promotion-product-recommendations/
The design of data warehouses is meant to solve this problem by bringing different areas of the business together. Star schema support fact and dimension tables. There can be multiple facts and shared dimensions. The idea is to reuse data as much as possible and create a holistic view of the company. This works well for traditional reporting, but data warehouses cannot solve complex network problems.
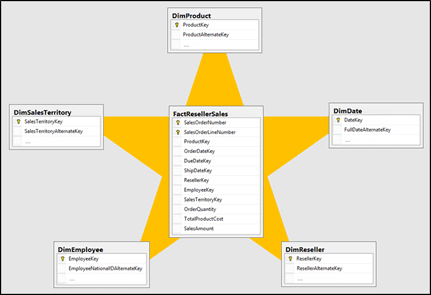
Source: https://docs.microsoft.com/en-us/power-bi/guidance/star-schema
Following are the reasons this does not work:
- Joins are expensive – Even with a big data system, tables are separated, and joining them together requires matching between the primary key and foreign key every time. There is an entire chapter of a book dedicated to understanding how Spark handles internal join operations.
- Table relationships are not natural – Modern big data systems no longer have the concept of primary keys and foreign keys, despite the fact that the concept is still valid. Every developer needs to learn every single relationship between tables to make decision making efficient
- Self-referencing relationships (for example, employee-manager hierarchy) beyond one hop (e.g., managers 3 levels up) are very hard on the system. If the query is not done right, infinite loops can happen very easily. There is another book discussing this shortcoming.
- It doesn’t come with graph algorithms that can analyze a network. For example, you can’t easily calculate suppliers having issues that will cause disruptions via RMDB.
What is a graph DB and how can it solve supply chain problems?
In order to address complex network problems, graph databases are designed to store an irregular structure optimally. Graph DBs store the nodes and edges natively. While it might look like this is similar to a join relation, every node and edge in the database forms a relationship. This relationship is explicit and not implicit to enforce referential integrity like in traditional RMDBs. These are called Knowledge Graphs. Below is an example of chaining different graphs together for risk mitigation.
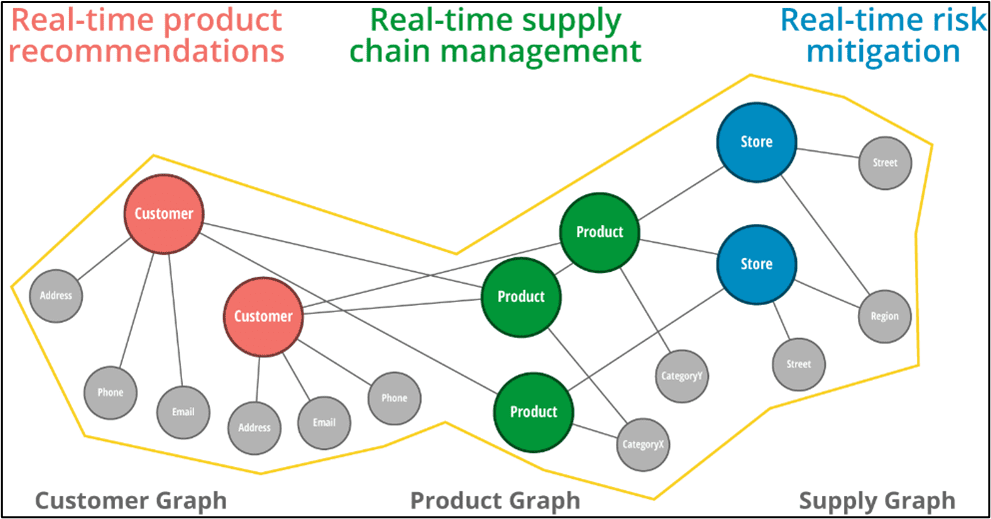
Source: https://neo4j.com/blog/retail-neo4j-personalized-promotion-product-recommendations/
Below are the advantages of Graph DBs and how they can help solve supply chain issues:
- In graph DBs, there only exist connected nodes, a node being a product, a supplier, or a plant. Similar to Google Maps, if the road exists, then it can go through. If it does not exist, it cannot go through. Hence there will not be matching and scanning. This ensures performance is lightning-fast.
- Graph designers can support workflow visualization. Every single hop of the supply network can be represented in a node and connected to another. Further, the relationship is not limited one to one between nodes and it can also be self-referencing. (For example, there can be multiple checkpoints for a truck route.)
- Graph algorithms help solves a variety of significant problems. For example, the most famous graph algorithm, called PageRank, was invented by Google to power its original search engine. Shortest path algorithm is used in Google Maps for routing between one point and another.
Results from graph analytics can improve the accuracy of a machine learning model – experiments show that by leveraging the outputs from graph algorithms, like PageRank and Centrality, as a feature in the machine learning model, it will improve the prediction accuracy because the model will have additional information that would previously be difficult to obtain.
- The recent research in Graph Neural Networks is based on graph structures, so having graphs natively stored is beneficial to the input of GNNs.
- Storage saving – by representing the relationship with an edge, the graph can scale to very large. Imagine a 100 node graph if each node needs to connect to each other, that will require 10,000 entries in a database table. Edges are much smaller to store.
The simplest yet powerful form of graph
Truck routes or flight routes can be represented as a series of from and to locations. These basic, everyday logistics are not the easiest problem to solve because, at a minimum, we want to be able to get an answer of the route from point A to point B in a matter of seconds. If it took Google Maps 10 minutes or more to calculate a route, this would not be acceptable to most users. This graph can be represented like the following:

The California truck route contains about 1,000 point-to-point[O1] [JY2] . It is simply a form and to map illustrated in the above diagram, but it is not an easy task to answer questions such as:
- Which is the most important route in the state of California? In my supply chain network?
- What is the shortest distance between point A and point B?
- If one route is unavailable, how can I pick an alternative route with ease?
- What is the cost associated with the alternative route?
With graph algorithms, these questions can be answered with ease, and with graph DB, these questions can be answered in a split second, aka real time. This is why graph DB can play a pivotal role in a complex and intertwined supply chain network.
Below is a diagram of the full California truck route obtained at the official CA website. Despite the fact that the design is relatively simple, the whole route can be complicated and challenging to manage using databases/spreadsheets or with bare eyes. Hence, we need to unleash the power of Graph DB to unlock the values within a network.

Diagram: State of California truck route found at dot.ca.gov
The supply chain graph
A fully connected supply chain graph has a lot of components. Below is an example of a knowledge graph for supply chain that connects raw materials to customers. Because the data points are connected with each other natively, it becomes very easy to trace the lineage of materials to products to consumer. Even if the relationship does not exist, we can leverage machine learning to do link prediction to infer hidden relationships in order to find new suppliers or new customers.

Diagram: A typical supply chain network from material to customer
Conclusion: While graph theories are not new, they have been dominated by big corporations like Google and Facebook for a number of years, mainly due to their complexity and difficulties in scaling up to Internet scale. With the rising of cloud in recent years, the two big players Neo4j and TigerGraph are both promising graph database vendors. They offer end-to-end graph storage, graph analytics and graph machine learning. Despite the fact that graph ML capabilities in Graph DBs are limited, it is fairly easy to export the graphs to geometric frameworks like PyG and DGL for experimental and state-of-the-art Graph Neural Networks. All these platforms are starting to gain popularity in the open-source world as opposed to guarded secrets by big corporations. Data engineers and data scientists should start paying attention to the usage of graphs to solve real-life problems.