

I became a true data hound after a stint as a market analyst in the semiconductor industry. The role involved these activities:
- First, to estimate and forecast global subscriber demand for systems;
- Then, learning enough about hardware systems design to estimate the number of wireless chip sockets each end-user device or piece of infrastructure equipment contained;
- Finally, tracking wireless chip and material manufacturing trends, so we could segment and forecast by chip type.
The habits and mindset I developed as a data hound, forecaster, and spreadsheet jockey inform the way I track emerging data technology trends to this day. So I thought I’d share the main techniques anyone can use to make better guesses about how markets for technologies and systems will evolve. These techniques are even useful when doing quick, back-of-the-envelope guesses about tech evolution.
Keep in mind that there is no substitute for better data or the best foundational knowledge to build on top of. Most good forecasters are compulsive researchers and data junkies who’ve spent many years learning from others and teaching themselves what they need to know. And the more you know, of course, the more you realize how little you really know.
But if you become a student dedicated to studying a particular market, your knowledge base and ability to guess will become better than most. My boss used to say, “Remember, you know more about the topic you did the market study on than anyone else at this point in time.” And that was true, because he gave us the time to do the research, and the focus of each study was on the market for very specific chips, and we did forecasting at several levels.
Once you can harness repeating patterns you’ve learned, you can expand the footprint of what you’re forecasting.
The seven steps
1. Think in market penetration or S-curve terms. Penetration or sigmoid function curves are common in market forecasting. Consider Gartner’s Hype Cycle, for instance. It’s an S-curve with a peak and a trough built into it that factor in the short-term influence of the market hype associated with widely-discussed information technology markets.
The S-curve model forces the forecaster to assume that adoption will build very slowly to begin with and then accelerate once a critical mass of adoption (~20 percent) has been reached. That’s a trustworthy assumption when it comes to emerging markets. Invariably, many of those who are enthusiastic about a new product category will overestimate market growth over the short term, and consequently, underestimate market growth in the long term. This illustration from Garnet Hertz describes the phases of the S-curve using the example of new media markets.
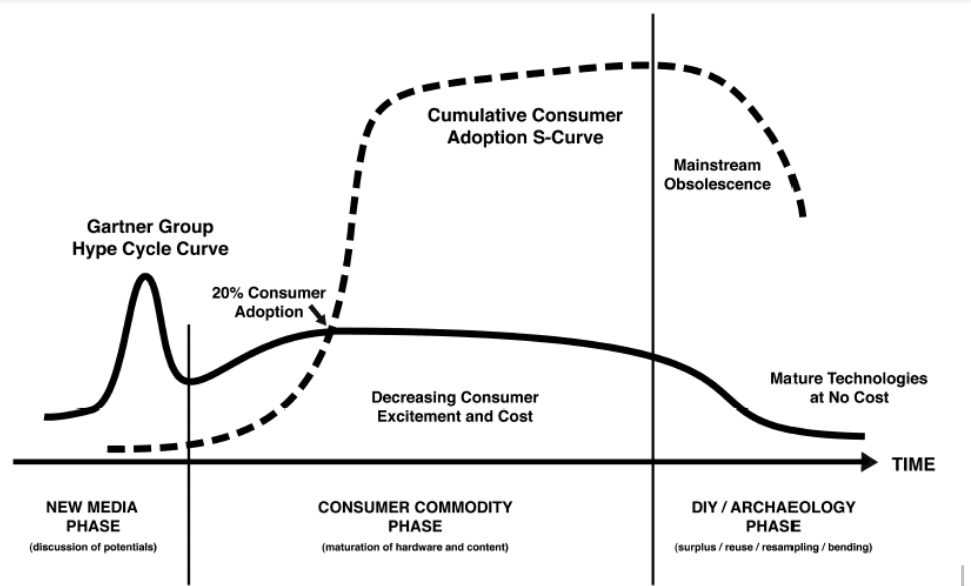
Creative Commons Attribution-NonCommercial-NoDerivs 2.0 Generic (CC BY-NC-ND 2.0)
As you can see, Hertz’s chart describes new media gaining adoption (the slow start), rapidly growing (the stick part of the hockey stick), and then saturating the market as it commoditizes. The end phase describes what happens as the tech becomes obsolete and loses its potential for participants to earn a profit.
2. Learn and quantify what you can about the installed base. The term “installed base” refers to how much of a new product or service has been sold into a particular geographical market, or an aggregation of those markets. It’s the historical record year by year of market growth. It’s important to collect the data points you can, to be able to start fitting your S-curve.
“Installed base” is also a helpful term when it comes to newly competing technology products intended to penetrate existing markets. For example, the US was one of the earliest adopters of electricity and telephony. That’s why smart grid and communications technologies have been so slow to gain adoption in the US, by comparison with China, for example. “Fighting the installed base” is what the US has been doing a lot of when it comes to established IT.
3. Make the best use of open source. Government agencies and trade associations, for example, are great sources of basic economic and market information that you can use to build your foundation for a credible forecast.
4. Segment markets and value chains in a logical, relevant, yet researchable way. IT research firms such as IDC spend quite a bit of time evolving their IT taxonomies by segmenting new markets and relating those to more mature markets. Avoid mixing apples and oranges or conflating different levels of a hierarchy in your analysis.
5. Creating and populating smaller subsegments of markets in your forecasts imply fewer errors in the aggregate. Data points on the installed base that inform your forecast will be sparse, and you’ll have to fill in the gaps with estimates. The better the sizing of your subsegments, the better your overall segmentation sizing will be. And keep in mind that some segments will be too small to matter much, while others will be so large that small changes in sizing will matter quite a bit.
6. Find and interview people who know what you need to know to create a forecast. Professional market analysts do lots of interviews to tap the brains of those who know about emerging markets. Sometimes a single interview can be the difference between a good forecast and speculation.
7. Triangulate to get better guesses. The term “triangulation” refers to fixing a point in a three-dimensional space with the help of three data points from different vectors. But it can also mean corroborating or refining a finding with the help of additional sources.
The more you work with the qualitative and quantitative sources on a new market, the more you’ll get a feel for market dynamics, the nuances of how demand grows and shifts, and the nature of specific market entrants and what they’re offering.
Forecasting can’t happen in a vacuum. It’s a collaborative effort. The most helpful forecasts trigger feedback that can refine the next iteration. The more you dig up good sources doing desk research or from the people you talk to, the more forecasting becomes an interaction. Social media can help you sound out nuances if you’re selective about who you follow and do community-building on the topics you’re covering or most interested in.