
People around the globe are more actively using social media platform such as Twitter, Facebook, and Instagram etc. They share information, opinions, ideas, experiences and other details in the social media. The business communities have become more aware of these developments and they want to use the available information in their favor. One of the ways to understand the people opinions on the product they are using is by collecting tweets related to those products. Then performing the sentiment analysis on the tweets collected on a particular topic. This research focuses on the collection of tweets related the airline services pertaining to the four regions which are Europe, India, Australia, and America region. Tweets related to various airlines from the American regions such as Delta, United, Spirit, Southwest and Jet Blue are collected. From Indian region, airlines are Indigo, Air India, Jet Airways, Vistara and Spice Jet. European airline such as Lufthansa, Air Berlin, Turkish, KLM, and Easy. From Australian region, Virgin, Qantas, Tigerair, JetStar, and Sharp tweets are gathered. The Tweepy is a python library using which the data collection is carried out. Figure 1 shows the collecting tweets pertaining to airlines from the twitter using tweepy.
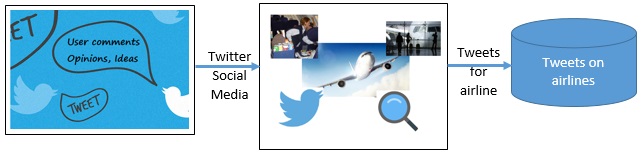
Figure 1. Airline tweets collections.
Sentiment Analysis
To understand the consumer’s voice, the Twitter data analysis plays a vital role. Using sentiment analysis on the tweets, one can recognize positive, negative or neutral tweets. This kind of sentiment analysis makes airline to understand customer feedback and incorporate in a constructive manner. The companies can improve the customer services. Also, this sentiment analysis can help to make better market strategies. Based on sentiment analysis the companies will come to know how customers are thinking and take a competitive advantage. In figure 2 the sentiment analysis of airlines tweets is shown and airlines can take advantage to improve their services.
The sentiment analyzer such as VADER or TextBlob uses a collection of words associated with the sentiment score i.e. lexicon. Using this lexicon, the sentiment analyzer provides various scores such as positive, negative, neutral and compound score.
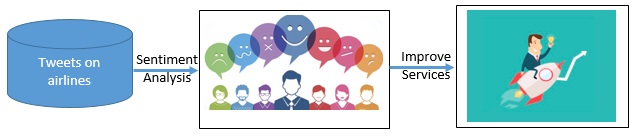
Fig. 2 Sentiment analysis of airline tweets.
Sentiment Visualization
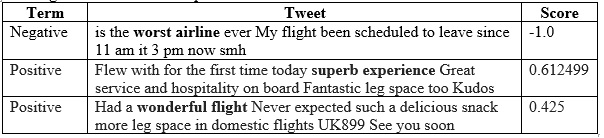
Using Tweepy python package, tweets for various airlines are collected. From Indian airlines, 6172 tweets, from European airlines 14835, American airline 13200 and Australian region 21024 are collected. After applying TextBlob on these tweets, sentiment scores are determined. The following table shows an example of airline tweets and their sentiment scores.
Using sentiment analysis on tweets the airline services can whether customers have a good opinion or bad opinion about their flights and services. The sentiment of tweets for a specific airline can be analyzed over a period of time and these scores can be plotted against time. The variation in customer opinions and sentiments over a period of time can be observed. The following figure 3 show variation in sentiment score over a period of one month for Australian airlines such as Virgin, Qantas, Tigerair, JetStar, and Sharp. The mean sentiment score for each airline is plotted for each week for a month time. This plot is a good indicator of whether customer have a good opinion or there is any fluctuation in the sentiments.
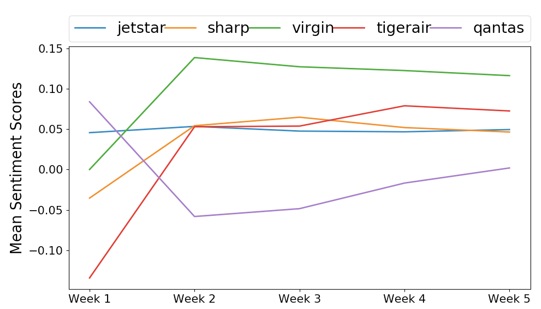
Figure 3. Mean sentiment score over a month time period.
In the following figure 4, the mean of positive sentiment and negative sentiment is depicted for each airline company. The mean of positive and negative sentiment for airlines of the European region are shown. The figure represents how one airline is performing with respect to other airlines in perspective of the customers. In order to improve the competitive edge of one airline over other airline companies, one wishes to keep the mean positive score higher than mean negative score. Also, companies like to have better positive scores than other companies.
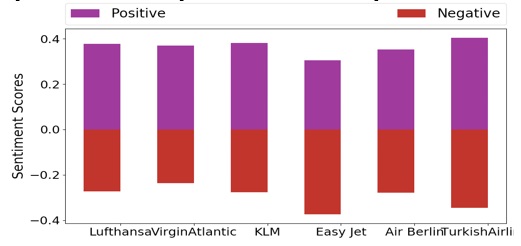
Figure 4. Mean of positive and negative sentiment.
The most common sentiment words will help the airline company identify their better performing aspect or the aspect that they have to improve upon. The most common negative terms in the tweets for an airline helps to understand that aspect the company has to improve. The most common positive terms in the tweets make companies pride on. These are the best-appreciated terms by the customers. The companies like to improve upon negative terms and at the same keep their most appreciated aspect intact. Figure 5 shows most positive terms occurred in the collection of tweet for the various airlines.
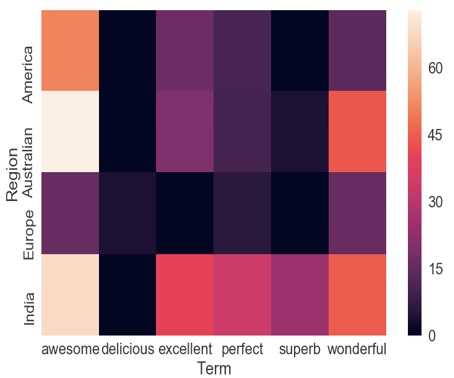
Figure 5. Most common positive terms in various airlines.
Bigrams are terms occurring together in the tweets. The most common bigrams which occurring either in positive tweets and negative tweets are collected. The bigram helps to understand the positive or negative perspective of the customer in a better way. These bigrams can be shown as pie charts with their frequency. The most common bigram in positive tweet displays the success story of the airline company. Figure 6 shows a pie chart with the frequency of bigrams from positive tweets.
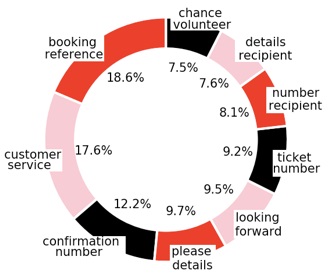
Figure 6. Most common bigrams in positive tweets.
Research Paper
The research on consumer loyalty evaluation using twitter data is appeared in:
http://thesai.org/Publications/ViewPaper?Volume=9&Issue=6&C…
Cite the Work
Please cite the following research paper:
Rida Khan, Siddhaling Urologin, “Airline Sentiment Visualization, Consumer Loyalty Measurement and Prediction Using Twitter Data”, in International Journal of Advanced Computer Science and Applications (IJACSA), volume 9, issue 6, pp. 380-388, 2018.
Further Projects and Contact
For further reading and other projects please visit
Dr. Siddhaling Urolagin,
Department of Computer Science
BITS Pilani, Dubai Campus, Academic City
Dubai, United Arab Emirates