
This article was written by Michael Grogan.
It is often the case that a dataset contains significant outliers – or observations that are significantly out of range from the majority of other observations in our dataset. Let us see how we can use robust regressions to deal with this issue.
I described in another tutorial how we can run a linear regression in R. However, this does not account for the outliers in our data. So, how can we solve this?
Plots
A useful way of dealing with outliers is by running a robust regression, or a regression that adjusts the weights assigned to each observation in order to reduce the skew resulting from the outliers.
In this particular example, we will build a regression to analyse internet usage in megabytesacross different observations. You will see that we have several outliers in this dataset. Specifically, we have three incidences where internet consumption is vastly higher than other observations in the dataset.
Let’s see how we can use a robust regression to mitigate for these outliers.
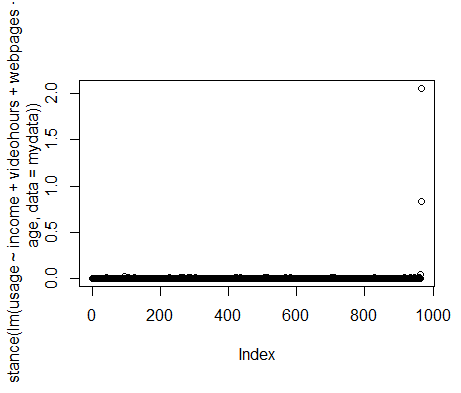
Firstly, let’s plot Cook’s distance and the QQ Plot:
Cook’s Distance
QQ Plot
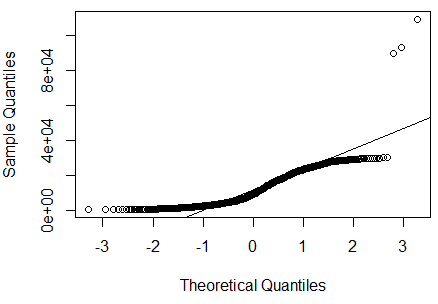
We can see that a plot of Cook’s distance shows clear outliers, and the QQ plot demonstrates the same (with a significant number of our observations not lying on the regression line).
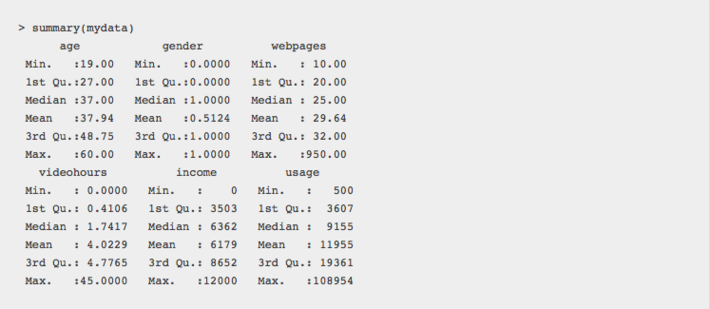
When we get a summary of our data, we see that the maximum value for usage sharply exceeds the mean or median:
To read the rest of the article, click here. For additional reading, browse our resources about regression or outliers.