
The challenge
Recently a colleague asked me to help her with a data problem, that seemed very straightforward at a glance.
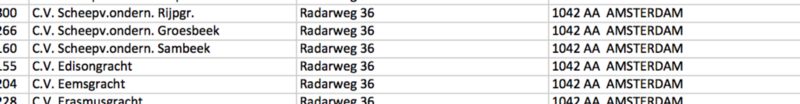
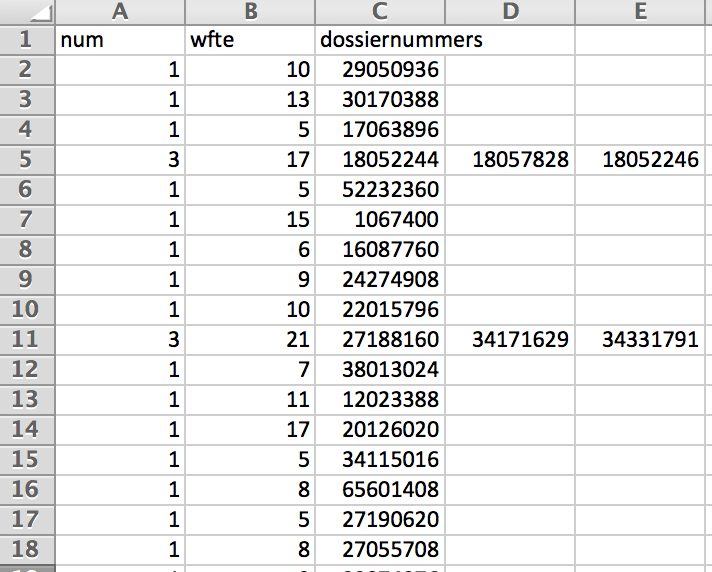
She had purchased a small set of data from the chamber of commerce (Kamer van Koophandel: KvK) that contained roughly 50k small sized companies (5–20FTE), which can be hard to find online.
She noticed that many of those companies share the same address, which makes sense, because a lot of those companies tend to cluster in business complexes.

However she also found that many companies on the same address are in fact 1 company divided over multiple registrations.
Which are technically different companies, but for this specific case should be treated as 1 single company with combined work force.
So we just had to group companies that ‘belong’ together and sum the FTE working there as 1 entity.
Approach
Of course I did some if-then-else coding at first, but A. that became a mess quite quickly and B. Where is the fun in that?
So I defined the steps towards a dynamic, scalable and configurable solution:
- Load/Clean the data
- Create a distance metric
- Make combinations of all data
- Manually train combinations on matches
- Train the model
- Run all combinations through the model
- Make a graph of all linked records
- Extract all connected vertices and save them als unique groups
- Combine these groups in a single data source with 1 id, summed FTE’s and list of grouped id’s
Any of these steps can be accomplished by a plethora of tools, libraries and languages, but 1 seems suitable for (almost) every one of them:
Ok I might be a bit biased and I think Python with SciKit learn would also suffice, besides Spark seems a bit overkill, but I love Scala and Spark…
So I fired up good ol’ Spark
1. Load/Clean the data
The data was supplied as Excel, so a simple “Save as..” csv started this step
Furthermore this step was pretty straight forward; the data was pretty clean. I just selected the fields/features that could be of interest for the model.
I’ll get to the KvKRecord case class in a bit
2. Create a distance metric
To see if 2 records from the same data source ‘match’ you’ll have to compare every combination, in theory.
The comparison itself is the entire challenge of this endeavour, that’s where machine learning gets involved.
But the ML model still needs a ‘feature vector’ it can train, test and predict on, so I needed to create a method that compared two KvKRecords and returned this ‘feature vector’
I chose to create a Vector where every element corresponds to a distance metric between each property of the case class.
I normalised the distance between integers using Math.log10 and a division to get all numbers between 0 and 1 (I knew the range beforehand). Not the best approach, but I had a strong suspicion that these wouldn’t matter anyway, so I spend hardly any time on tuning the non-String features.
For the String comparison there are many, many options
But I ended up using Jaro-Winkler. I wanted to try others, but this seemed to work pretty good and returns a normalised value between 0 and 1.
3. Make combinations of all data
I had some advantage here, because the address data is very clean, so I didn’t have to create a cartesian product, but just a join on address. Using the joinWith method the KvKRecords stayed intact and the feature vector was tacked on.
Now we have a filtered dataset of all combinations of companies on the same address.
I have to note that this is somewhat a cheat. There are companies that have the same address, but different address notations, even though the supplied data is very clean.
Eg. “Keizersgracht 62” and “Keizersgracht 62–64” and “Keizersgracht 62-A” may be considered as the same address, but ruled out this way. However we may also assume that whoever registered these companies, used the same address if it was the same company? I don’t know, but the effect seems negligible/non-existent after a quick manual check.
One alternative is to do a full cartesian product (match each company to each other company) and train the tool on companies that are in different streets/cities. I’m afraid the sheer difference between not-even-remote-matching companies pushes the model away from the subtle nuances between companies that are actually at the same address.
4. Manually train combinations on matches
All these combinations & vectors don’t get you anywhere, if you don’t have something to train your ML on. I needed a labeled dataset for supervised learning.
Manually creating these based on the original csv with Excel, seemed error prone and cumbersome, so as a good (read: lazy) developer I wrote a program that helped me create a labeled training set.
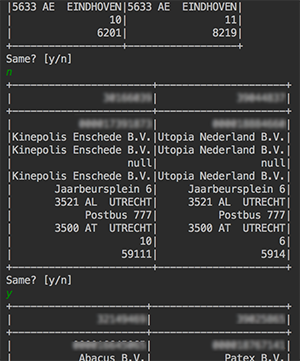
console output
I have to admit that I’ve only created about 100 labeled samples for this project (< 0.2%), but the features are pretty simple and the work was extremely boring, so I was ok with it.
The LabeledVector case class is used because it has properties named “features” and “label” that are default for the Spark MLlib models.
5. Train the model
Now that we have this nice labeled dataset we are ready to flex our machine learning muscles.
I have to disappoint you a bit though, because I’ve just created a straight forward logistic regression model using Spark’s MLLib, but it’s the result that counts.
Other projects might fare better with Random Forest, Perceptron or even Naive Bayes, but I got some good results based on this approach:
- Accuracy: 0.96
- Area under the ROC-curve: 0.92
(If anyone knows how to easily create a ROC/AUC-plot from Spark, please let me know)
More time could be spend on hyperparameter tuning, but having more than 80 training samples would help as well 😉
6. Run all combinations through the model
The next step was to apply this model to our combined dataset
Because our comparableDataset already had the required ‘features: Vector’, I could just apply the model, which added the label and probability columns.
For the linking we are now just interested in actual matches, so the resulting dataset has only combinations of companies that are considered the same.
PredictedVector is just as straight forward case class again.
7. Make a graph of all linked records
Having a dataset of all linked companies is nice, but to really understand the data I had to group by ‘standalone groups’. Meaning:
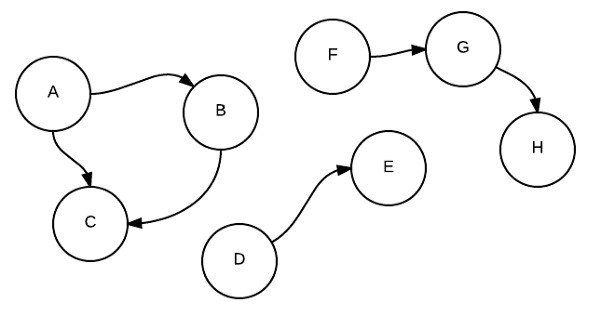
(A,B)
(A,C)
(B,C)
(D,E)
(F,G)
(G,H)
needed to result in:
(A,B,C)
(D,E)
(F,G,H)
Anyone familiar with discrete math / graph theory will notice these can be represented as graphs. There are many cool tools for working with graphs, one of my favourites is Neo4j, but again Spark offers GraphX out of the box, so we’ll stick with that for now.
I just had to turn our dataset into 2 RDD’s, namely: edges & vertices.
8. Extract all connected vertices and save them als unique groups
Now that there was a graph (linkedGraph), I wanted to find all disconnected subgraphs and group those together.The magic keyword here is: Connected Components
The GraphX method connectedComponents created a list of tuples of each VertexId and the smallest VertexId in it’s subgraph.
Reversing these tuples and grouping on the smallest VertexId created a list of connected VertexId’s c.q. subgraphs
Using a broadcast lookup I remapped these VertexId’s to the corresponding KvKRecord.
In the end I’ve ended up with a dataset of all unique groups with a list of all KvKRecords in that group.
9. Combine groups in a single data source
The final step was to create a csv file for my colleague to use for her specific use case.
The entire code, while not as interesting for the process, was meant to flatten these results into a csv file that can be interpreted by MS Excel in the dynamic format of
[number of linked companies];[total FTE];[company id / column]
Conclusion
In the end, the seemingly simple data problem, had quite an elaborate solution and took me way more time than expected.
But I was not disappointed by the result, nor the choice to build it all in Scala & Spark. I’ve learned a lot and feel confident that it will improve this and other projects over time. Also the fact that I can run this code on my machine, as well as a 100 node cluster in the cloud, without changing any line of code, still amazes me.
The reason I share this is to:
- Inform you about the powers of Spark: it’s not scary, it’s fun!
- De-hype machine learning: It’s cool, but still software development with trial & error.
- De-hype big data: It’s not always the size that matters. data is still data.
- Help / inspire others that have similar issues: Sharing is caring 😉
- Get feedback on this article, my approach, the code, anything: please!