
Sometimes when dealing with performance metrics, there are contradictory signals. For instance, although both are desirable, it is common for efficiency and efficacy to be in opposition. An agent in a call centre can handle lots of calls while at the same time getting few sales; this is especially true if the agent’s main objective is to do lots of calls. This is a highly efficient person albeit unsuccessful in terms of expanding the business. Conversely, another agent by spending a greater amount of time per call might get more sales; this will be the case if the agent’s objective is to gain sales. This person is effective although not necessarily as efficient. This is a straightforward case. In real life, an organization might have the metrics but an incomplete understanding of the dynamics. I recommend the use of an operational simulation to emulate the company’s key operations in terms of its metrics.
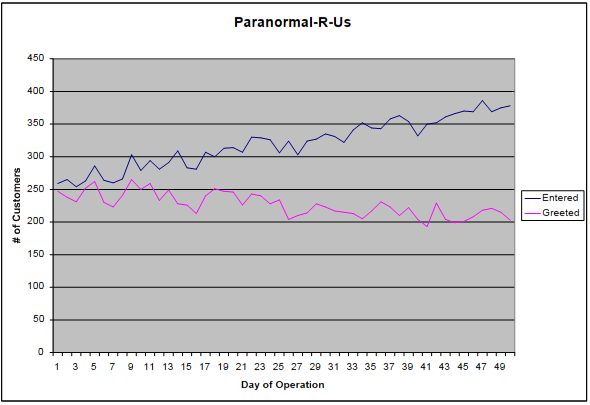
Below I present some simulated data from a retailer I invented called “Paranormal-R-Us.” (I apologize if such a retailer exists in real life.) This retailer keeps track of two metrics: 1) the number of people entering the store; and 2) the number of greetings. Each sales associate is required to approach shoppers to say the following: “Greetings, Earthling! Can I offer you a guided tour of our facilities?” Clients seem to prefer being individually led through the store (perhaps for greater privacy) – so they can pose paranormal-type questions and to make purchases. Just recently, somebody bought 8 ounces of cured Yeti meat and half a dozen incisors ostensibly from incubi that inhabit remote islands in the Pacific.
The proprietor, upon seeing the chart below, is shocked by the decline in greetings even as the number of shoppers rises. Although business seems to be doing well, the store is missing out on potential sales.
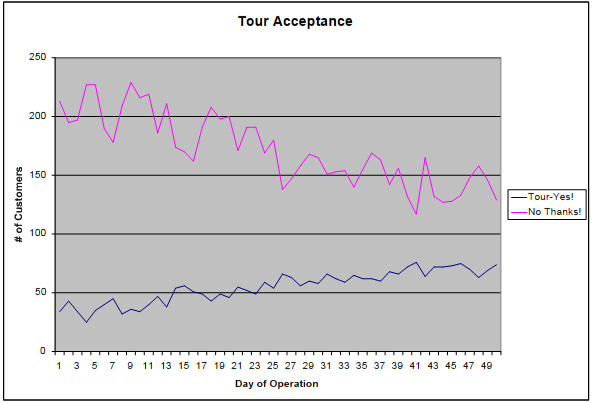
The analyst for the store points out using the chart below that more customers have been going for a tour of the facilities. Tours takes about 30 minutes; they typically result in the sale of big-ticket items. If all of the greeters are busy giving tours, nobody would be available to greet new visitors to the store. Paranormal-R-Us seems to be a victim of its success.
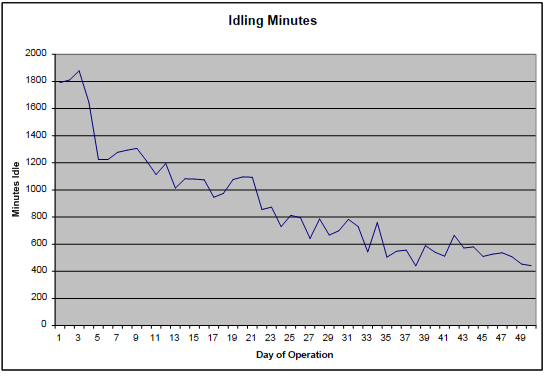
If we set aside the particulars of the storyline, even if the owner accepts the analyst’s explanation to some extent, there remains a serious management concern. If greeters fail to greet, they are not doing what they are paid to do. The owner who likewise has access to the database fed by the data-loggers points out: although idling time has declined a lot since the store opened, actually there is more than 400 minutes of idle time. Sales associates are literally sometimes just waiting for customers. It is necessary to “convince” the owner that the metrics show a need to hire more employees. She refuses to hire more workers just to see idle times increase! There is a need in this case not so much to win an argument but rather substantiate the dynamics between metrics. It is the kind of situation where an operational simulation can provide useful reference points.
I create an operational simulation whenever I want to mimic the real-life behaviours of an operation. I break the simulation into two components: 1) the operating cycle which covers production for a single day of operations; 2) and the main simulation control which invokes the cycle many times usually with some kind of changing variable. The part that generates the output is associated with the main simulation control. The output stream should therefore be global rather than limited to the individual cycles. I personally feel that simulations are easier to perform using a language that doesn’t follow the code in a fully linear flow – the way various versions of BASIC once did. Similarly, a person should not try to create a simulation by thinking in a fully linear manner – although I certainly appreciate the allure of being linear sometimes. Linearity is a limitation when there are loops and cyclical invocations galore.
The data for the charts on this blog were created using a simulator that I call CC Sim. I wrote the functional code in about an hour in Java. Using this simulation, the outcomes experienced by Paranormal-R-Us would indeed be possible if the “probability of asking for a tour” is increased. According to the simulation, if clients are made more likely to ask for a tour, the greeting rate will start to decline. Moreover, idling would begin to decline. So the position taken by the analyst fits the situation. Some people reading this might say, well this should have been obvious even without a simulation. What then would be the obvious way to resolve the problem? The simulation isn’t just about confirming the nature of a problem but also experimenting with potential solutions.
Conceivably the proprietor of the store might insist that the greeting rate increase; and so it will. However, it is not possible for employees to make use of time that they do not have available. The tour rate might start to decline, which can cause the sale of big-ticket items to also decline. Every organization that has the capacity to gather and analyze operational metrics should consider incorporating simulations – especially since metrics interact with and sometimes contradict each other in production environments. When the dynamics between metrics are unclear or not fully understood, it can be all too easy to turn to gut instincts. It takes great understanding of the business along with extensive exposure to the metrics to build simulations. The data scientist is in an ideal position to assume the role of simulation builder – or conversely be embarrassed by the person whose actionable insights are supported by the augmented reality of realistic simulations.