
As we all know in today’s world of quick results and insights nobody wants to spend time in understanding the core concepts of certain statistical terms while performing analytical routine. One statistical term that is talked a lot but known very less in terms of its mechanics is R Squared statistics a.k.a. coefficient of determination. This statistics helps to measure the closeness of the data to the fitted line of regression.
It is also worth mentioning that by squaring the correlation coefficient statistic one can calculate the R Squared value. However, I want to take few step back to clear the fog with regards to the calculation of this statistics and kill the confusion around it (I know this is quite and extreme statement). As “the devil is in the details”
So let’s get started…..
What is R Square Value?
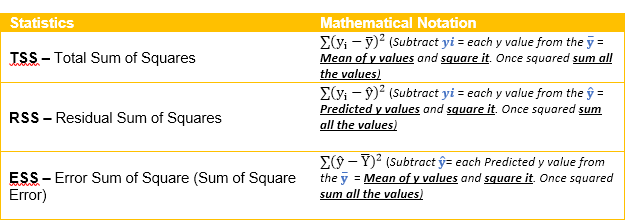
To simply put it, it is Total Sum of Squares – Residual Sum of Squares / Total Sum of Squares, quite a mouthful, let’s make it a bit simple, it can also be put across as Error Sum of Squares / Total Sum of Squares. Some of you might even chuckle and say, but we don’t even know how to calculate the above mambo jambo and my answer to you all would be “no worries let me explain it with the help of mathematical notations!” – Yes, mathematical notations!
Let’s make the above calculations more obvious by looking at an example:
Step 1: Calculating the Mean value of the Y variable and Total Sum of Squares
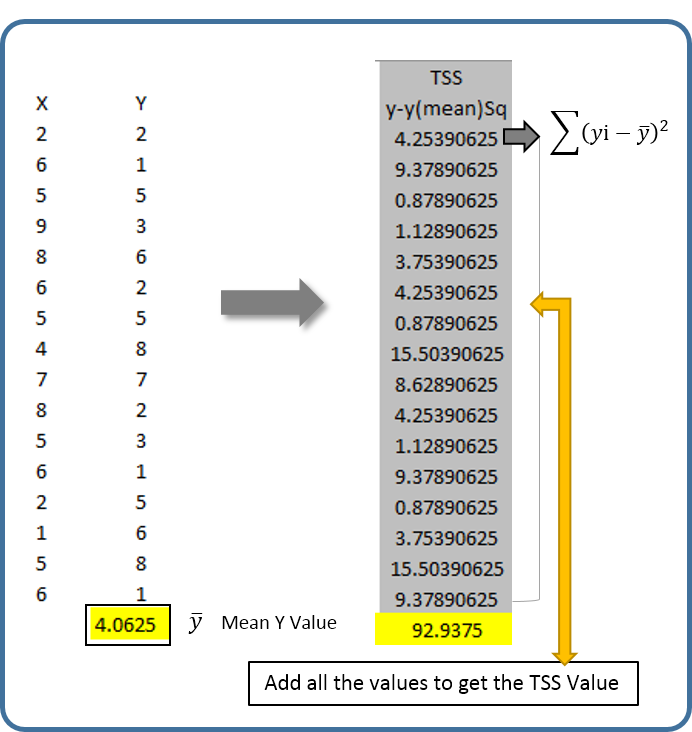
Calculate Mean value of the Y variable and subtract the mean value from each Y variable and square it. Once squared sum all the values to compute the Total Sum of Square Values. Note: This procedure will compute two elements Y mean and TSS
Step 2: Calculating the Residual Sum of Squares
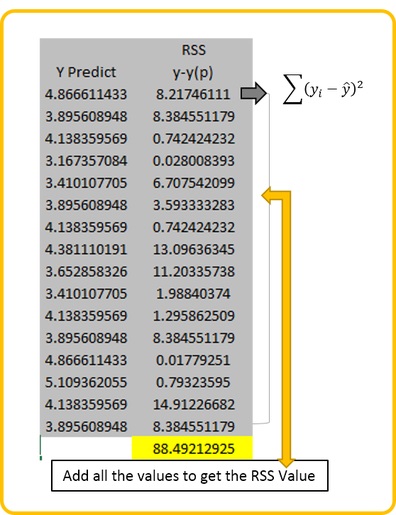
Calculate this statistic by subtracting each Y value from the Predicted Y value and square it. Once squared sum all the values. Note: Predicted value can be derived by using the regression equation for this example the regression equation used is y = -0.2428x + 5.3521
Step 3: Calculating the Error Sum of Square (Sum of Square Error)
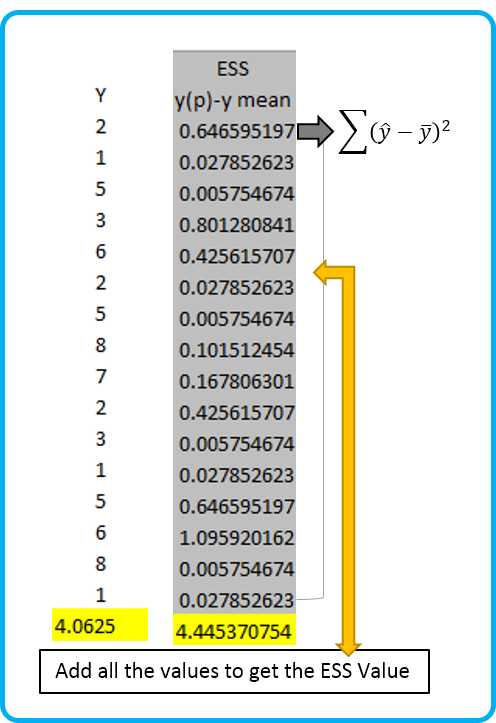
This statistic can be calculated by subtracting Yhat value a.k.a Predicted Y value from the Y mean value (that we calculated in step 1) and squaring it. Lastly, sum all the values to get the ESS statistics
Once all the important elements are calculated you are ready to compute the R Squared value.
- Long form R Square Calculation Method = (TSS – RSS) / TSS
92.9375 – 88.4921 / 92.9375 = 0.0478 (R Sq. Value)
- Short form R Square Calculation Method = ESS / TSS
92.9375 – 4.4453 = 0.0478 (R Sq. Value)
To prove the above two calculations, I created a scatter plot chart in Excel and also cross validated the information by using the Regression analysis by utilizing Excel’s Data Analysis Tool Pack.
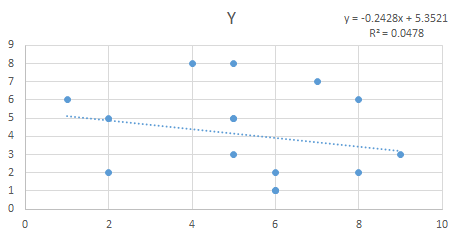
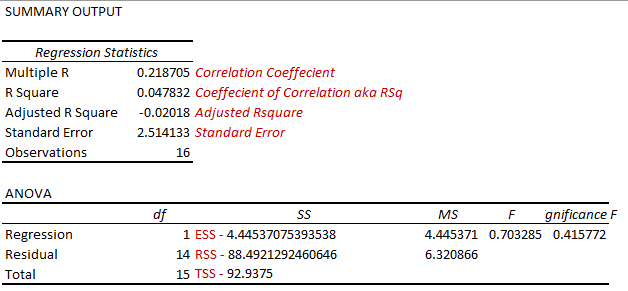
You can also verify the statistics that we calculated are pretty much similar to the statistics calculated by the Data Analysis Tool pack plugin of excel.
The next question that might be a good candidate for further discussion related to R Square Value is Adjusted R Square, we usually use this statistics when we have multiple predictor variables. The standard R Square value tends to increase with the number of predictor variables, which might not be a good way to look at the models performance. Therefore, when working with multiple predictor variables statisticians and analysts prefer to use the Adjusted R Square Value.
How to calculate this value is pretty simple and straight forwards. Let’s look at its notation to understand the mechanics of this statistics as well.
![]()
N = Number of points in the data sample
P = Number of independent predictor variables or regressors i.e. number of variables in your model barring the constant.
How this works in our example?
Pretty simple, 1-(1–0.04783 (R Squared Value)) * (16 (Number of Y data points) – 1) / (16 –1 (predictor variables, in case you have >1 predictor variables you will mention that number here) –1) = –0.02018 (Check the Adjusted R Square value from the Data Analysis Tool pack’s Regression Analysis results)