
Introduction
This is an analysis of the Kaggle 2018 survey dataset. In my analysis I am trying to understand the similarities and differences between men and women users from US and India, since these are the two biggest segments of the respondent population. The number of respondents who chose something other than Male/Female is quite low, so I excluded that subset as well.
The complete code is available as a here. If you like this post, do login and upvote!
You can also use the link to go to the dataset and perform your own explorations. Please do feel free to use my code as a starter script.
Analysis
Some questions that the analysis tries to answer are given below:
a. What is the respondent demographic profile for users from the 2 countries – men vs women, age bucket?
b. What is their educational background and major?
c. What are the job roles and coding experience?
d. What is the most popular language of use?
e. What is the programming language people recommend for an aspiring data scientist?
f. What is the CEO profile?
Calculations / Data Wrangling:
1. I’ve aggregated the age buckets into lesser number of segments, because the number of respondents tapers off in the higher age groups. [Code in the kernel]
2. Similarly, cleaned up the special characters in the educational qualifications.
3. Also added a tag to the empty values in the following variables – jobrole (Q6), exp_group (Q8), proj(Q40), years in coding (Q24), major (Q5).
Observations
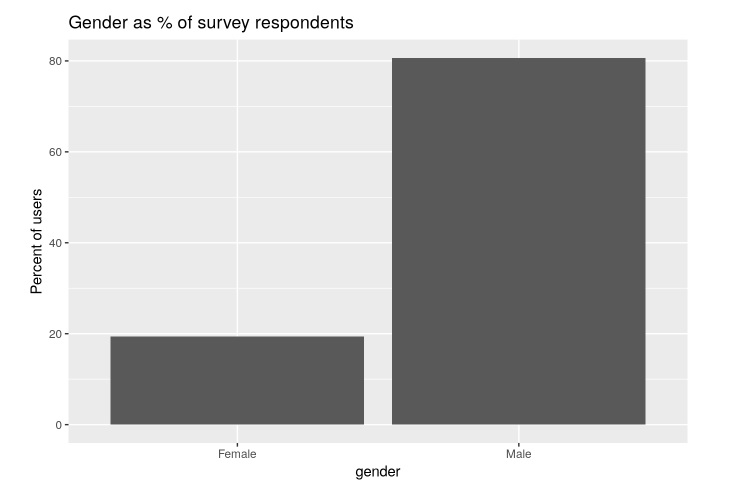
Gender composition:
Men outnumber women by 4:1, which is typical of tech jobs. Among women, almost 2/3rd are from US, and only ~38% from India. The men are almost split 50/50 among US and India.
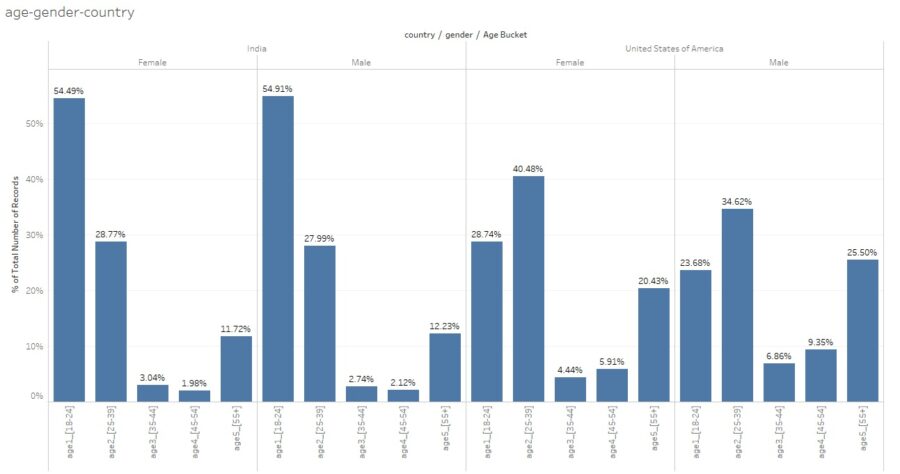
Age composition:
- Indians are much younger than Americans, with ~55% of Indian men and women falling in the youngest age bucket (18-24), and another ~28% falling in the (25-29) category. So almost 82% of the population is under 30 years of age!
- Among US respondents, the women seem a bit more younger, with 68% under 30 years, compared to ~57% men of women.
- However, in US there were a decent amount of folks in the 55+ category (~20% for women, and 25% for men. Compare it with Indians, where the 55+ group is barely 12%.
Education:
- Being coders, all segments had a large population of bachelors degree.
- US women were the most educated of the lot, with a whopping 55% with masters degrees and 16% with doctorates!
- Among Indians, women had higher levels of education – 10% with Ph.D, 43% masters degree, compared with men where ~34% had a masters degree and only 4% had a doctorate.
- The stat on Indians is interesting because Indians are younger compared to US respondents, so many more Indians seem to be pursuing advanced degrees.
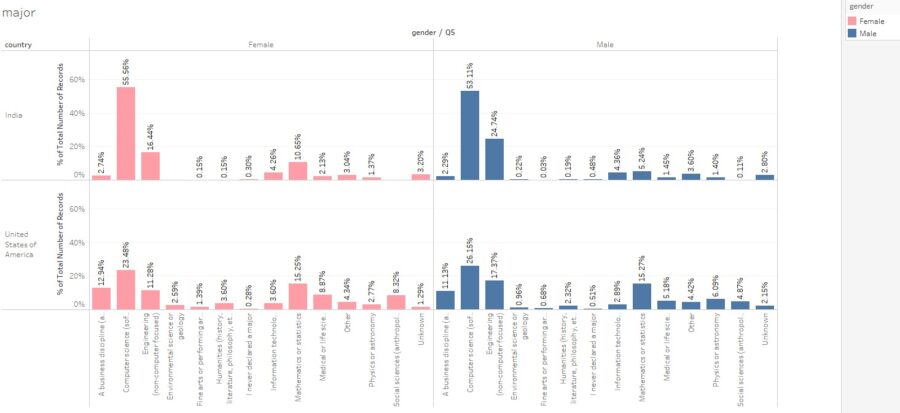
Undergrad major:
Among Indians, the majority of respondents added Computer Science as their major. From personal experience, this is probably due a combination of the reasons below:
- Indians have to declare a major when they join a degree program, and are rarely allowed to change,
- Choice of majors is not as wide as in the US.
- Parents tend to force kids towards majors which are known to translate into a decent paying job, which is engineering or medicine.
- A case of response bias? The survey came from Kaggle, so not sure if non-coding majors would have even bothered to respond.Among US respondents, the major is also computer science, but followed by maths & stats for women.
- For men, the second category was a tie between non-compsci Engg , followed by maths&stats.
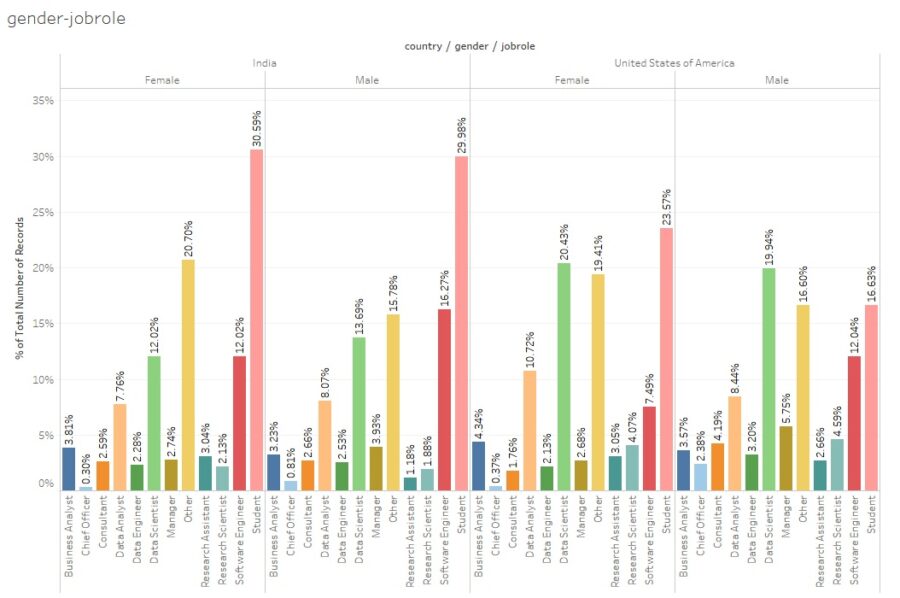
Job Roles:
- Among Indians, the biggest segment are predominantly students (30%). Among Indian men, the second category is software engineer.
- Among US women, the biggest category was also “student” but followed quite closely by “data scientist”. Among US men , the biggest category was “data scientist” followed by “student”.
- CEOs, not surprisingly are male, 45+ years from the US, with a masters degree.
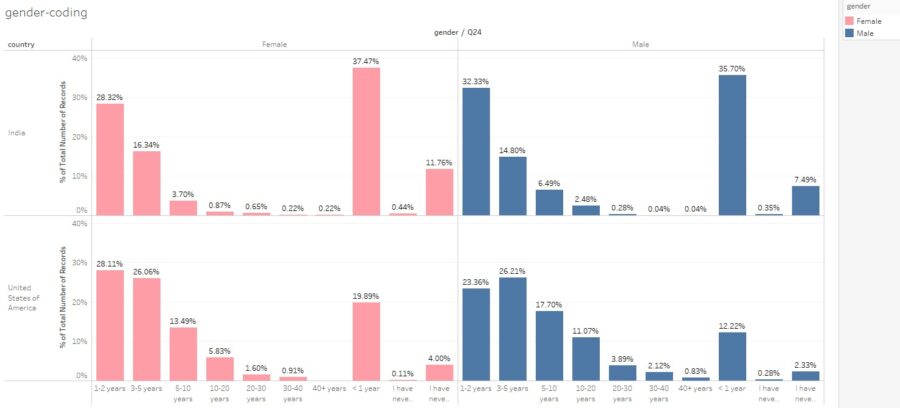
Coding Experience:
- Among Indians, most answered <1 year of coding experience , which correlates well with the fact that most of them are under 30, with a huge population of students.
- Among US respondents, the split is even between 1-2 years of coding and 3-5 years of coding.
- US Men seem to have a bit more coding experience than women, again explained by the fact that women were slightly younger overall, compared to US men.
Most popular programming language:
- Python is unanimously most popular language, discounting the number of people who did not answer.
- However, among US women, R is slightly popular too (16% favoring it).
- Among languages recommended for machine learning, again Python came first by a wide margin. These statistics also match this interesting article here on DSCC which also stated that Python is the best .
Conclusions:
- Overall, Indians tended to be younger with more people pursuing masters degrees.
- US respondents tended to older with stronger coding experience, and many more are practicing data scientists.
This seems like a great opportunity for Kaggle, if they could match the Indian students with the US data scientists, in a sort of mentor-matching service. - CEOs, not surprisingly are male, 45+ years from the US, with a masters degree.