
I suck at the NCAA March Madness® bracket selection process. I let my personal biases get in the way of making decisions based upon the numbers. I over-rate the well-known Big Ten conference and under-rate the lesser-known Mid Majors and fall in love with the most recent team I saw on TV win their conference tournament. You see, I fall prey to all the common decision-making traps – recency bias, over-confidence, anchoring, risk aversion, framing – that doom my brackets from the very beginning. (See the Appendix for more details on these decision-making traps.)
But this year is different because I’m going to take my gut feeling out of the selection process and let Google use the numbers to pick my brackets using “NCAA® March Madness®: Bracketology with Google Cloud” (notice all the registered “March Madness®” trademarks in case one thinks they can use “March Madness®” to tweak their “March Madness®” social following by overly using the “March Madness®” term!).
But even when using pre-configured, push-button Data Science, there is still some work that must be done by the humans. So even with all of its Machine Learning glory, there are still plenty of opportunities for me to screw this up!
Determine Metrics that Might be Better Predictors of Performance
For those data scientist wannabe’s, you can use Google Studioto explore the performance data of each of the selected teams (see Figure 1).
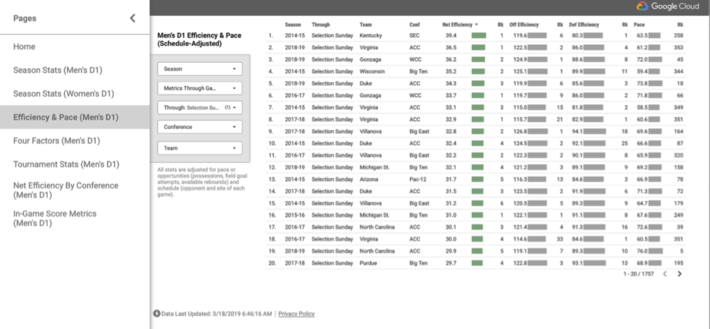
Figure 1: Google Studio
Unfortunately, Google Studio lacks the more advanced analysis features that allow you to easily “slice-and-dice”, and pivot and cross-tab the data with the strong data visualization capabilities that you would see from tools in Tableau. But if you are lazy like me and don’t want to waste time trying to codify the performance patterns and relationships buried in the data, you can use the simplified Google “Matchup Analysis” tool to guide your selections (see Figure 2).
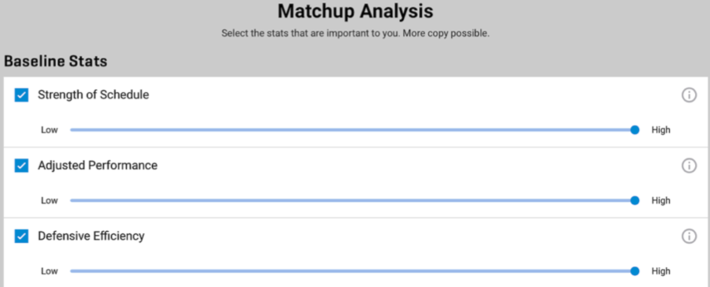
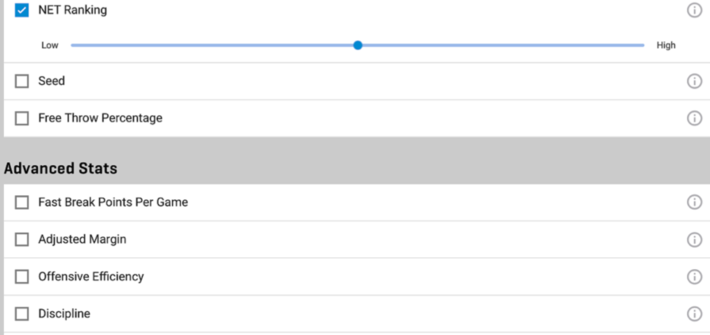
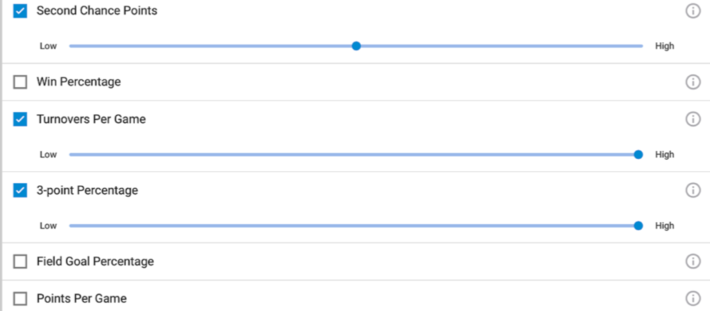
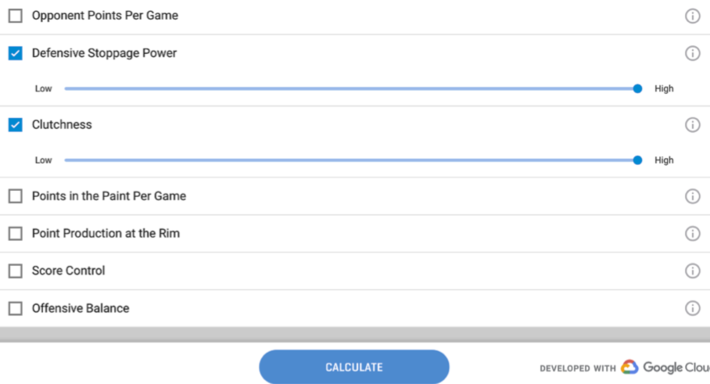
Figure 2: Google March Madness® Matchup Analysis
You just pick what variables you want and then weight them as either Low, Medium or High in predictive value, select the [Calculate] button and you are off to picking a winning bracket!
Setting and Testing Assumptions
You can see from Figure 2 the variables that I thought were most important from a prediction perspective. Now a really good Machine Learning algorithm would help me discover which variables are likely the best predictors of performance, but alas, no such luck here for this amateur data scientist.
So, to make my selection and the weighing of the variables, I found I had to first create assumptions that I would translate into the variables. My assumptions for a successful bracket are:
- Playing a tough schedule better prepares a team (Strength of Schedule, NET Ranking)
- Defense wins close games (Defensive Stoppage Power, Defensive Efficiency)
- The more possessions, the better (Turnovers Per Game, Second Chance Points)
- 3-point shooting is a game-changer (3-point percentage)
The other issue that I have with the Google selection tool is that I am only allowed three “weightings” per variable: Low, Medium or High. In a real world data science project, I’d use a Neural Network to help me identify and weigh the variables that I want to use to try to predict the winners in my brackets. And maybe use Reinforcement Learning to run my selections through an endless number of automated scenarios.
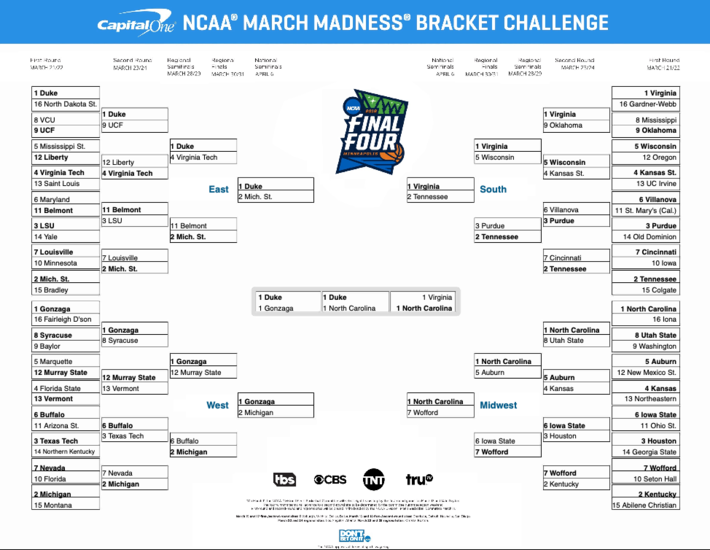
But alas, here is my bracket courtesy of Google!
Duke beating Virginia in the finals? All #1 seeds in the Final Four? Heck, I could have predicted that myself using my gut. Stupid Google Bracket selection tool…
Appendix: Common Decision-making Traps
Over-confidence. We put a great deal of weight on whatever we happen to know and assume that what we don’t know isn’t important. The casinos of Las Vegas were built on this human flaw (and why my son likes to say that “gambling is a tax on those who are bad at math”).
Anchoring Bias. Anchoring is the subtle human tendency to glom onto one fact as a reference point for decisions, even though that reference point may have no logical relevance to the decision at hand. During normal decision-making, individuals anchor, or overly rely, on specific information and then adjust to that value to account for other elements of the circumstance. Usually once the anchor is set, there is a bias toward that information.
Risk Aversion. Our tolerance for risk is highly inconsistent. Risk aversion is a manifestation of people’s general preference for certainty over uncertainty, and for minimizing the magnitude of the worst possible outcomes to which they are exposed. Risk aversion surfaces in the reluctance of a person to accept a bargain with an uncertain payoff rather than another bargain with a more certain, but possibly lower, expected payoff.
Framing. How a decision is stated or framed can impact what decision is made. Information, when presented in different formats, alters people’s decisions. Individuals have a tendency to select inconsistent choices, depending on whether the question is framed to concentrate on losses or gains.