
 Profit analysis is an integral part of analysis drills, which are conducted at regular frequency. Both finance and marketing departments are equally engaged in this activity — though both have a different approach to it. Variance analysis is a powerful tool, being extensively used by finance departments — but even for marketing, it holds no lesser value. With a traditional contributor analysis, already the executive presentations of marketing look a plenty, but addition of variance analysis will definitely be favoring.
As the name suggests, this analysis helps answer the very question of what led to the change or deviation — from budgetary estimate or analyzing periodic performance.
*for simplicity, will avoid variance due to Forex and Cost changes, which are generally the prerogative of finance department.
Reasons for Variance in Profit
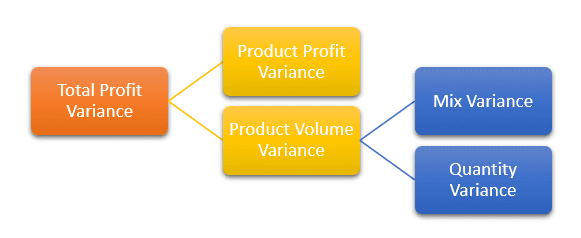
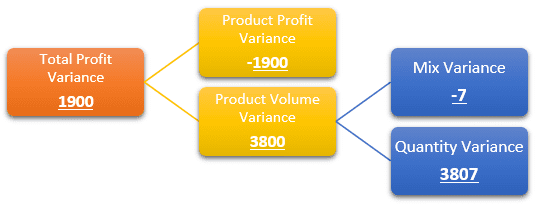
Always, the variance in total profit would be because of two factors –
1. Product profit variance — when the profit on a product changed
2. Product volume variance — when the level of sales changed
The Product volume variance is further split into two factors Mix variance and Quantity variance, which are analyzed in multi-product scenario. But, first let us understand a single product case.
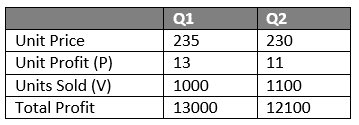
The first order variance is because of change in profit earned on a product or change in sold volume. Assuming sale of one product P1 across two different quarters.
 *ignoring currency
As seen, the unit profit decreased and the unit sold increased. Though the resultant total profit decreased, there are two forces, pulling the result in opposite direction. Now the questions are, what the pull of each individual force was, and how the decrease of 900 units in profit can be explained. In other words: What was the increase due to units sold and what was the decrease due to profit decrease.
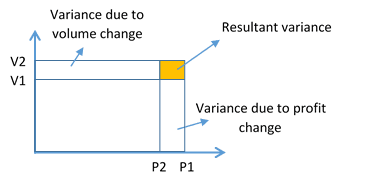
Profit-Unit Graph
As seen from the image, the colored box is the resultant variance. So, with formulae we can analyze individual pull.
Deviation due to volume change ΔV = (V2-V1)*P1
Deviation due to price change ΔP = (P2 -P1)*V2
ΔV = (1100–1000)*13 = 1300
ΔP = (11–13)*1100 = -2200
The net effect = ΔV + ΔP = 1300 + (-2200) = -900 (which is the actual decrease in profit)
Now a question may arise, why use V2 while calculating for deviation due to price change? Because, we are trying to get what more profit would have been made on final sale, had there been just price change.
This deviation analysis was adequate for single product portfolio, but it is always a multi-product scenario. And hence, it is important to analyze the impact of individual products on the total deviation. Enters Mix Variance and Quantity Variance.
Assume the following scenario: (ignoring currency)
Base Period (Q1) Sales
New Period (Q2) Sales
Mix Variance helps in quantifying the effect of deviation in the proportion (by unit sold) of products, compared to base period. If there are multiple products, change in sold units of one product, has an impact on mix of sales. And since each product is sold at a different profit, this can’t be ignored. With the same mix as base period, redistribute the new period sales. The difference between this value and actual sale reflects the impact of mix change.
Δmix = (V2 — V’2)*P1
Quantity Variance helps in calculating the impact of change in sales quantity compared to base period. If the mix is maintained at same values as base period, and redistribution of new period sales is done, the difference with base sale removes the impact of mix change and only quantity impact is considered.
ΔQ = (V’2 — V1)*P1
Even if total units of product sold are lower than base period, favorable Product volume variance can be achieved in case of favorable mix variance.
P1 is not changed -as done earlier-here since only impact of volume deviation is being analyzed
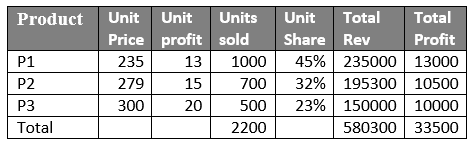
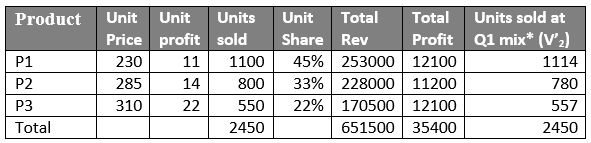
Calculating all the analysis factors/variances:
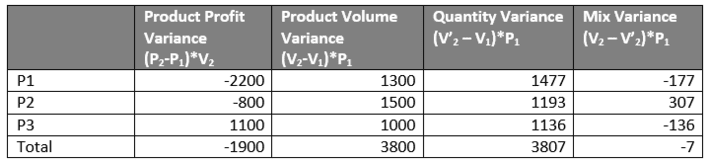
Profit variance analysis considering all 3 products:
Another way to represent this analysis, especially for executive presentations is through waterfall chart.
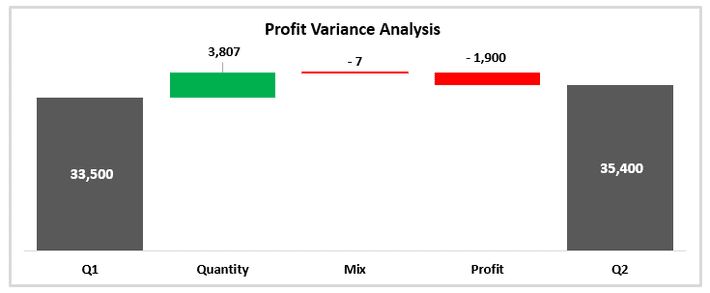
This variance analysis clearly depicts that:
1.All the gain in profit has come due to increase in unit total sold from 2200 to 2450
2.Change in mix has led to decrease — though minimal impact — in profit as the share of highest profit product P3 decrease from 23% to 22%, and is picked up by lower profit product P2
3.The total impact of changing the profit values for products is negative, which means the change was unfavorable and average profit per product (considering all 3 products) decreased
4.Despite increase in average price per product from 263.7 to 265.9, total units sold increased from 2200 to 2450. This means there were some favorable market environment condition
5.Even though average price increased, average profit decreased from 15.2 to 14.4. This means there were some negative factors (generally out of control) which led to fall in average profit. Company did an excellent job by anticipating demand and increasing the price, because of which increased cost had minimal impact
We can’t do the mix analysis for an individual product (even in multi-product scenario) hence for an individual product, it would always be confined to Product Profit and Product Volume Variance.