

Summary
Regression analysis is one of the methods supplied built-in with SAP BW Data Mining. Based on this method regression models can be created and configured to satisfy specific analysis requirements (e.g., choice between linear or non-linear approximation, etc.). The method includes regression-specific reporting that allows analysis of the modeling results. In this paper we are suggesting a number of ways to extend this reporting in order to improve insight into the results of regression modeling. The mentioned extensions are implemented via the following analytics:
- Dashboard – SAP BW Data Mining Regression Reporting
Business Requirements
We will set our focus on the method-specific (not problem-specific) indicators that appear on regression reporting in BW Data Mining. That means that we will not be considering the part of the standard BW Data Mining reporting that visualizes regression scores (predicted values) neither regression coefficients for particular regression models. Instead, we will concentrate on the indicators that provide insight as to the volume and quality of models input data, as well as the quality of approximation achieved via the models.
The abovementioned method-specific indicators can be viewed via either the basic statistics of models involved in analysis processes (transaction RSANWB, display the analysis process, right-click on the model and select to display basic statistics) or via the general statistics in a models results (transaction RSDMWB, display the model, choose the modeling results button in the models toolbar, choose the general statistics button in the toolbar of the main results graph).
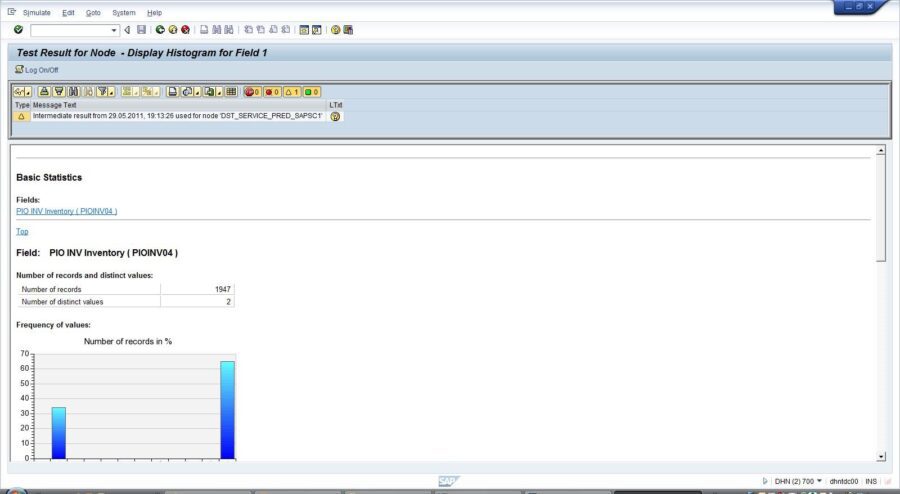
An example of visualization available via the basic statistics of an analysis process is provided in the below screenshot:
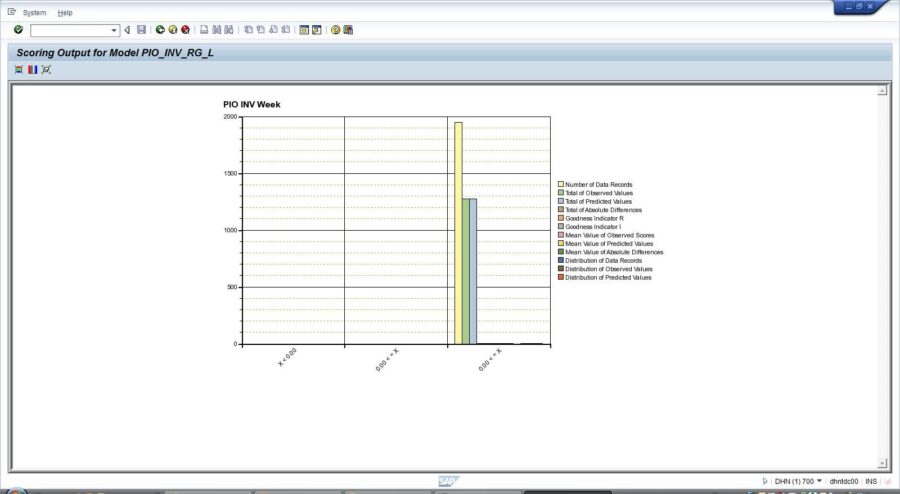
An example of visualization available via general statistics in a regression models results is provided in the below screenshot:
The above visualization functionalities cover well the basic needs of a user that would like to obtain insight in the results of regression modeling. Based on our practical experience with regression modeling in SAP BW Data Mining the following additional business requirements could be suggested:
- Ability to browse specific regression models to visualize their most important details without clicking into those models and studying them via a Display/Edit mode
- Ability to visualize the method-specific indicators of regression models without going into either basic statistics or general statistics of individual processes and models
- Ability to visualize the method-specific indicators per model variable with sufficient precision (i.e. not rounded to an integer or to only three digits after the decimal point)
- Ability to select and visualize in a graphical mode only the comparable method-specific indicators (in order to avoid difficulties with their visualization among the other indicators, usually with greater values)
- Ability to select and visualize only the details (indicators and data properties) of specific model variables
Analytics
The implementation of the above business requirements in the SAP BW Data Mining Regression Reporting dashboard is based on combining the functionality of the SAP BW Data Mining Model Reporting dashboard (find more details on this dashboard in SAP BW Data Mining Analytics: Model Reporting) with insight that is specific for SAP_REGRESSION and SAP_SCORING_WT_TABLE methods.
At startup, the SAP BW Data Mining Regression Reporting dashboard displays three tabs:
- Model Master: contains the overall list of SAP BW Data Mining models defined in our system with their most important data properties, plus a set of controls allowing to browse and filter that list
- Regression/Scoring Models Table: contains the list of models based on SAP_REGRESSION and SAP_SCORING_WT_TABLE methods with their variables and method-specific indicators, plus a set of controls allowing to browse and filter that list
- Regression/Scoring Models Graphs: contains the bar chart to visualize the method-specific indicators for the models and variables chosen using the two other tabs, plus a set of controls to select for visualization specific indicators
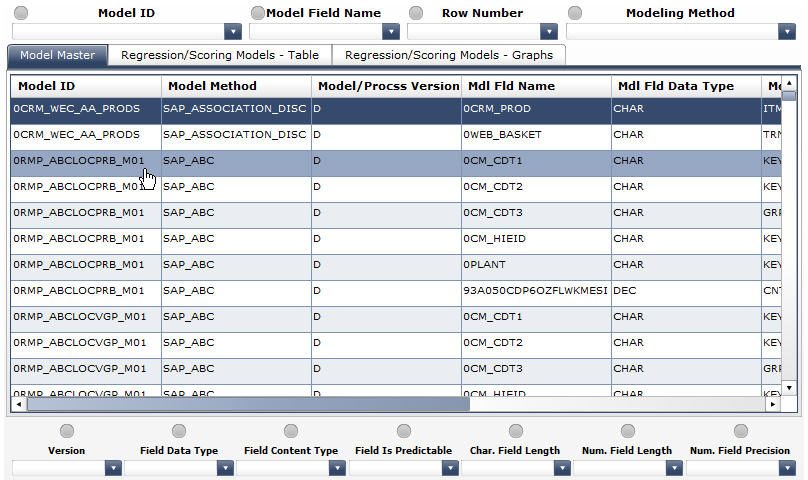
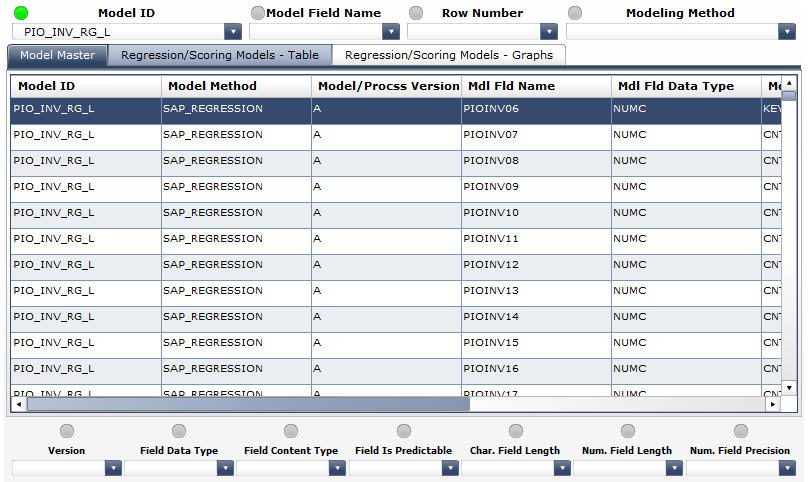
- The following columns have been enabled in the list at the Model Master tab (see the screenshot below):
- Model ID a unique identifier, the technical name of the model in the overall model list
- Model Field Name an identifier of a variable (field) of the model in the overall model list
- Modeling Method the modeling method on which the model is based
- Version the version of the model
- Field Data Type the type of the data contained in a model field
- Field Content Type the role that a model field plays in the model
- Field Is Predictable contains X if the field is a predictable field, i.e. the one that if filled with prediction results
- Character Field Length the total length of a character field
- Numeric Field Length the total length of a numeric field
- Numeric Field Precision the number of digits after the decimal point in a numeric field
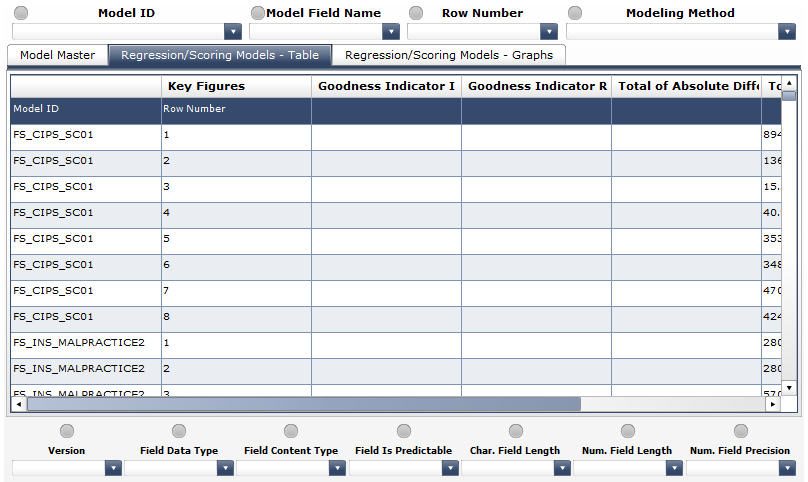
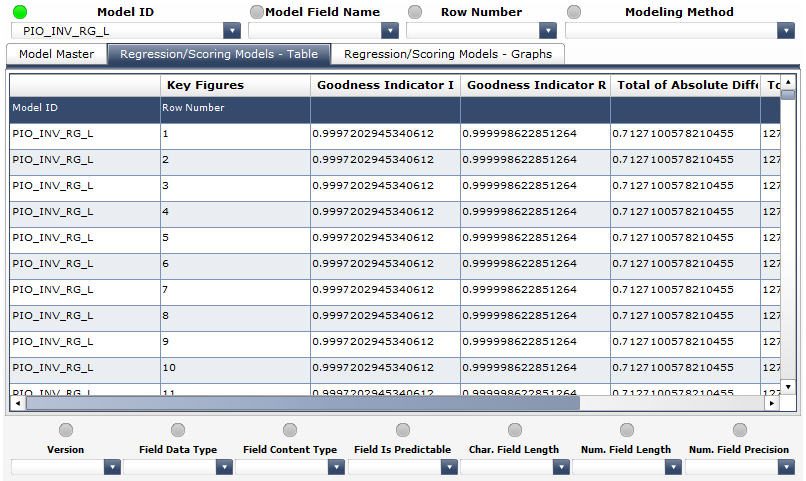
The following columns have been enabled in the list at the Regression/Scoring Models Table tab (see the screenshot below):
- Model ID a unique identifier, the technical name of the model in the regression-specific model list
- Row Number an identifier of a variable (field) of the model in the regression-specific model list
- Goodness Indicator I an indicator of goodness of approximation
- Goodness Indicator R an indicator of goodness of approximation
- Total of Absolute Differences the sum of absolute predicted/observed differences
- Total of Predicted Values the sum of predicted values
- Total of Observed Values the sum of observed values
- Number of Data Records the number of data points loaded into a regression model during its training
The selectors of the dashboard match the columns of the lists and allow limiting the models and variables visualized via the lists to specific criteria. Each time a specific value is selected, the respective selectors status indicator turns green.
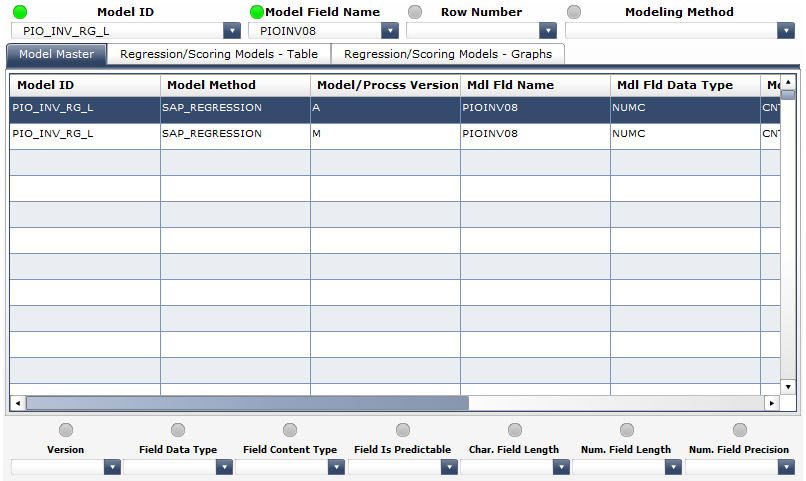
In the below screenshot, the PIO_INV_RG_L value is selected via the Model ID selector. The lists of variables in the Model Master and Regression/Scoring Models Table tabs are immediately refreshed to display only the records corresponding to the model with the technical name PIO_INV_RG_L:
In order to visualize only the details of a specific variable, we must select this variable using the Model Field Name and Row Number selectors. The Model Field Name selector applies to the Model Master tab:
The Row Number selector applies to the Regression/Scoring Models Table tab:
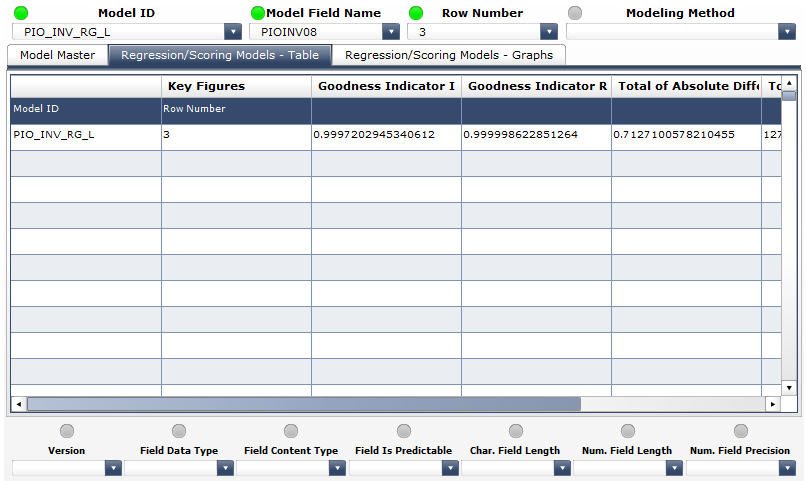
The necessity to indicate two different identifiers for the same variable is due to the fact that the variables are coded differently in the SAP BW Data Minings internal tables the overall model master table uses the model field names indicated in the model definitions, while the regression-specific model master table uses the numbers of the rows occupied by the respective variables in the regression model definitions. We are working on the link among the two sets of identifiers and will implement it in the further versions of this dashboard. For the time being, a reasonable workaround is based on the fact that the order in which the model field names and of the row numbers for a selected model appear on the dropdown lists is the same which allows us to simply count the same number of labels from the top of the dropdown lists in the Model Field Name and Row Number selectors in order to make sure that the same variable is selected in both of the respective tabs.
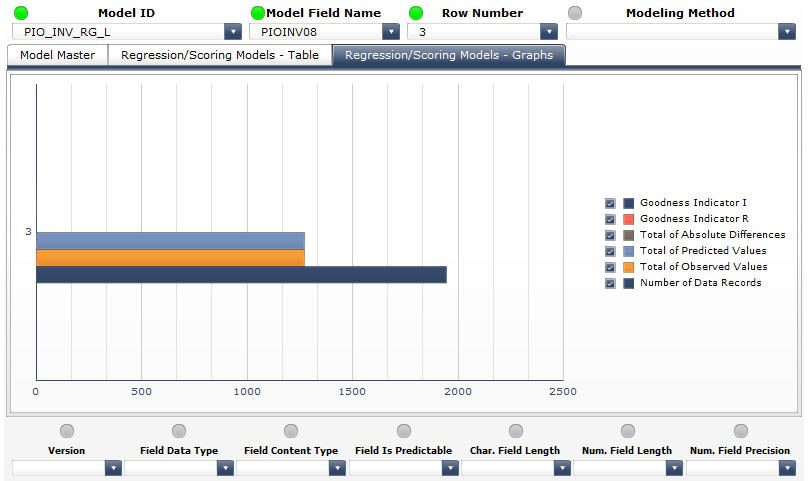
Finally, we may need to obtain graphical visualization of the values of the method-specific indicators displayed in the Regression/Scoring Models Table tab. Such visualization is implemented in the Regression/Scoring Models Graphs tab. In the below screenshot we can see that all of the six method-specific indicators for the variable PIOINV08 (corresponds to the row number 3, which is displayed next to the graphs Y-axis) are displayed, but because the values for the two goodness-of-fit indicators, as well as for the total of absolute differences indicator, are so small compared to the values of the other indicators that we can only see three bars in the bar chart (with the bars corresponding to the indicators with smaller values molded into the Y-axis):
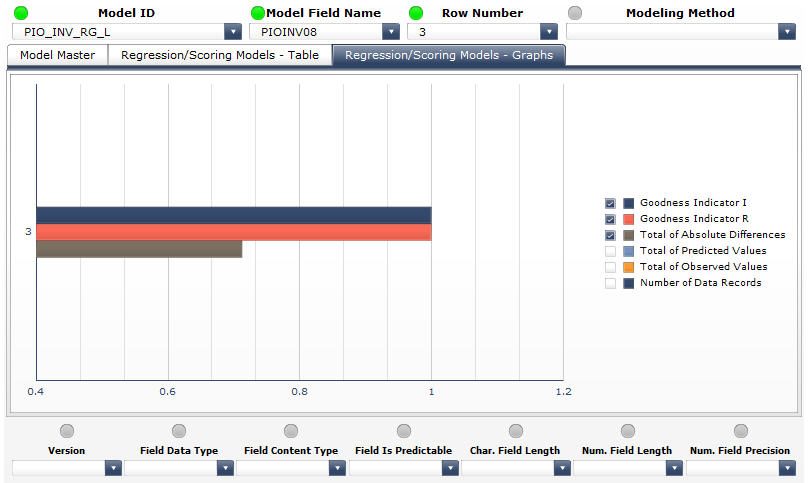
A similar inconvenience, as it was mentioned before, could be found with the standard SAP BW Data Mining reporting related to regression modeling results. Our dashboard proposes and efficient workaround we can uncheck directly in the graphs legend the indicators with greater values and to have the indicators with smaller values visualized along the automatically rescaled X-axis:
Typical Use Cases
The following could be examples of the typical use cases in which the usage of the SAP BW Data Mining Regression Reporting dashboard could bring benefits:
1) A data mining specialist would like to visualize the models with Y as predictable variable and to study method-specific indicators of those of them that are based on the SAP_REGRESSION method.
Use scenario: in the Model Master tab, select the records that correspond to the SAP_REGRESSION method using the Modeling Method selector, then limit further your selection by choosing Y via the Model Field Name selector and X in the Field Is Predictable selector. The dropdown list of the Model ID selector will contain the technical names of the models we are interested in. Choose those models one by one in the Model ID selector and study their method-specific indicators in the Regression/Scoring Models Table and Regression/Scoring Models Graphs tabs.
2) A data mining specialist would like to visualize the models based on the SAP_REGRESSION method that contain at least 10 variables with the predictable variable having exactly N digits after the decimal point.
Use scenario: in the Model Master tab, select the records that correspond to the SAP_REGRESSION method using the Modeling Method selector, and then limit further your selection by choosing X in the Field Is Predictable selector and the value closest to or exactly matching N in the Num. Field Precision selector. The model list in the Model Master tab will display the technical names of the models matching all of the above criteria except for having at least 10 variables. To apply this last criterion, switch to the Regression/Scoring Models Table tab and choose 10 in the Row Number selector (if 10 is not available, there are no models that match this criterion). Choose one by one the model technical names displayed in the Model ID selector in the Regression/Scoring Models Table tab to verify whether the models selected with the help of selectors in the Model Master tab are compatible with having at least 10 variables criterion. If on selection of a model technical name via the Model ID selector the model list in the Regression/Scoring Models Table tab displays at least one row, then the respective model satisfies all the criteria. If the list is empty, the respective model has less than 10 rows.
3) A data mining specialist would like to visualize models based on the SAP_REGRESSION method that contain variable Y as predictable variable and to find out which of those models provides the highest value of the goodness indicator R.
Use scenario: in the Model Master tab, select the records that correspond to the SAP_REGRESSION method using the Modeling Method selector, then limit further your selection by choosing Y in the Model Field Name and X in the Field Is Predictable selectors. This will leave in the dropdown list of the Model ID selector the models that satisfy the above criteria. Switch to the Regression/Scoring Models Table tab and choose one by one the model technical names displayed in the Model ID selector to visualize the values of the goodness indicator R. Those values may differ across a models variables, and then to identify the highest value per model we could either apply sorting in the Goodness Indicator R column (by clicking on that columns caption), or to switch to the Regression/Scoring Models Graphs tab and to remove selection from all the options in the graphs legend except for Goodness Indicator R. By choosing the model technical names available in the Model ID selector and observing the highest value of the goodness indicator R per model, we can identify the model which provides the highest value for this indicator.
)