
In supervised machine learning algorithms, Random Forest stands apart as it is arguably the most powerful classification model. When Microsoft developed their X-box game which enables you to play as per the movement of your posture, they used Random Forest over any other machine learning algorithm and over ANN (Advanced Neural Networks) as well !
I am assuming that if you are reading this blog, you are well versed with Decision Tree Classification. However, if you are not, need not worry. You can refer to the following link and have a look through it (even if you just want to recap).
Classification and Decision Tree in R
This blog is quite theory intensive as the model demands such. I have tried to avoid using statistics and mathematics as much as possible as they are quite exhaustive and are beyond the scope of the blog.
This blog is divided into three parts:
- Random Forest -What, Why, How
- Random Forest – Machine Learning Model
- Random Forest Model in R
Part A: Random Forest – What, Why, How
What is Random Forest?
Random forest is an ensemble machine learning model. An ensemble machine learning model is a model which is a collection of several smaller models. The Random Forest model of machine learning is nothing but a collection of several decision trees. These trees come together to a combined decision to give the output.
The fundamental concept behind Random Forest is wisdom of crowds. That is to say, if a group of people (in this case trees) come to a decision (in this case classification) after a discussion (in this case absorbing the flaws internally) the result is a very good one (in this case accuracy). Adding on to the fundamental concept is that just like in a crowd the best decision comes when the decision makers are not influenced by each other’s opinion, the Random Forest model should have trees which are uncorrelated.
Why a Random Forest?
Often data points are extremely complicated in arrangement. One such pattern of arrangement can be shown as follows:
A simple classification model like CART or Logistic Regression may underfit the model and make wrong predictions. Further, the time taken for the system to process it would also be considerably high. Therefore, we are losing out on both ends. In such scenario, it is better to use several machine learning models capped under one. Random Forest, being a collection of several Decision Trees does exactly that. Further, overfitting is avoided and the model can also handle missing values. It can also be used to model categorical values.
How is a Random Forest made?
Let us say our data points are arranged in the following manner in the multi-dimensional space
Our objective is to draw a line which classifies the data points in the above diagram based upon colours. Further when the next data point is to be predicted, the model should be able to classify where it will belong. We do it by making several trees and then classify the model based upon a cumulative decision of the trees. The entire process of making the tree can be summarized as follows:
– Start with one tree and build successive number of trees on a randomly selected dataset
– Individually the trees may not be very good but together they are very powerful
– The idea is to make a crowd which can collectively come to a good decision
– We keep making trees until the solution is optimized
– When the required number of trees are made, we take the vote of the trees present
– Each individual tree in the Random Forest spits out a class prediction and the class with most votes becomes our model’s prediction
The prerequisites in making a Random Forest are:
- There should be some actual signal in the features so that the model does not do random guessing
- Predictions and errors made by individual trees need to have low correlations with each other
The first prerequisite can taken care of while selecting the dataset manually. It is the second prerequisite, decorrelating of trees, which requires our attention. So the question arises, how do we create uncorrelated trees? Well, we need not worry. Random Forest does that too buy a technique called Feature Randomness.
Feature Randomness
Feature Randomness basically means introducing randomness into the model. Random Forest does this by implementing several decision trees together. A single decision tree is made by choosing the important variables as node and then sub-nodes and so on. Random Forest makes several trees like that considering different variables which might have been otherwise ignored. Let us see this more clearly with the following example.
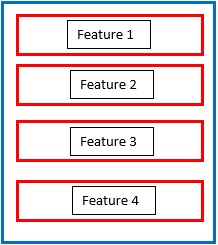
Suppose a dataset has the features feature 1, feature 2, feature 3 and feature 4 with feature 1 being the most important one followed by feature 2 which is also significant. The other two features are not as significant as the first two.
 https://insightimi.files.wordpress.com/2020/05/image-8.png?w=133 133w” sizes=”(max-width: 286px) 100vw, 286px” />
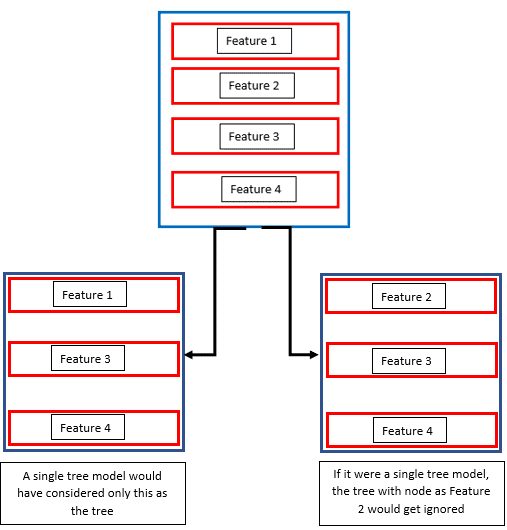
A normal decision tree model would only consider feature 1 and make a node and go on to build a tree. This would make feature 2, which also very significant unable to contribute to the model. In a Random Forest, where there are several trees, a tree would also be made considering feature 2 as the node. This way, the model picks up nodes in a random manner and makes a forest. These trees are then trained differently on same dataset and they come up with different predictions.
Part B: Random Forest: Machine Learning Model
When we talk of Random Forest from the machine learning perspective, a few technical terms become very important. These are Bootstrap, Bagging and Boosting. Let us see what each of them imply.
Bootstrap
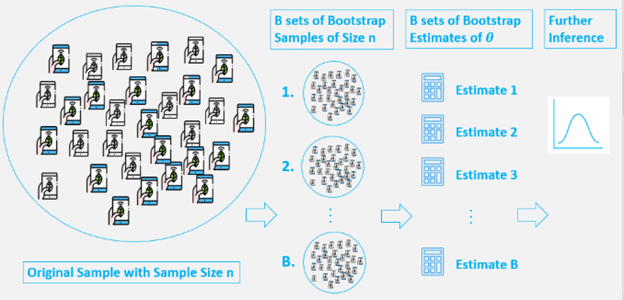
The bootstrap is an extremely powerful statistical tool that can be used to quantify the uncertainty associated with a given estimator or a statistical learning method. The idea of bootstrap is to make an inference about an estimate (such as sample mean) for a population parameter on the sample data. It is a resampling method by independently sampling with replacement from an existing sample data with same sample size n, and performing inference among these resampled data.
Generally, a bootstrap involves the following steps:
- A sample is chosen from a population with sample size n.
- From this original sample, a sample is drawn with replacement and it is replicated B number of times.
- Each of these resampled samples are called bootstrap samples. There will be B bootstrap samples.
- Evaluate the statistic of µ for each of these bootstrap samples. So there will now be total B estimates of µ.
- Now, a sampling distribution with these bootstrap statistics is constructed and used to make further statistical inference like estimating the standard error of µ and a confidence interval for the same.
Thus, we have generated new data points by re-sampling from an existing sample and make an inference just based on these samples.
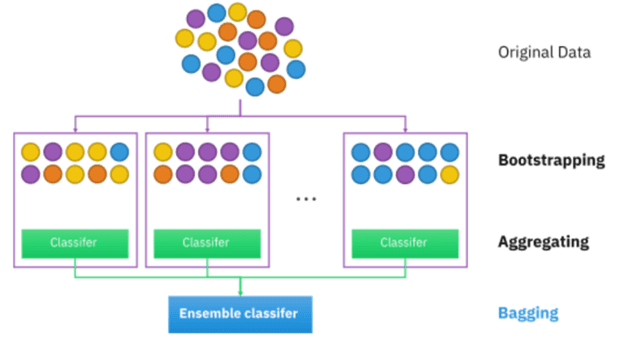
Bagging
Bagging is the short form of Bootstrap Aggregation. It is a powerful method to reduce the variance of a statistical model. They are extremely useful to reduce the variance of decision trees.
Decision trees suffer from high variance. However, if we split the data into two parts at random, and fit decision trees to both the halves, the result we get is quite different. It helps in avoiding overfitting and improves the stability of the machine learning algorithms.
In bagging, a certain number of equally sized subsets of a dataset are extracted with replacement. Then, a machine learning algorithm is applied to each of these subsets and the outputs are ensembled. You can see a depiction of the same below.
Random Forest
Random Forest is an improvement over bagged trees by decorrelating the trees. Due to this uncorrelated nature, the trees will protect each other from individual errors. Each time a split in a tree is considered, a random sample of ‘m’ predictors is chosen as split candidate from the full set of ‘p’ predictors. A split can use only one of the ‘m’ predictors, where,
m = sqrt(p)
The above formula implies that the number of predictors at each split is approximately equal to the square root of total number of predictors. An average of (p-m)/p number of splits will not consider strong predictors and other predictors will have more of a chance. This will ensure less variability and more reliability.
In other words, when we build a random forest at each split in the tree, the algorithm is not even allowed to consider a majority of the available predictors. This is the same rationale of Feature Randomness which was explained above.
Random Forest Algorithm
Step 1: Pick at random K data points from training set.
Step 2: Build decision tree associated with thee K data points.
Step 3: Choose the number of N tree of trees you want to build and repeat Step 1 and Step 2.
Step 4: For every new data point, make each N trees predict the category to which the data point belongs and assign new data point to category that wins majority vote.
Important hyper parameters related to the above algorithm
Parameters that determine the predictive power of the model:
- n parameters – This is the number of trees that will be built. It increases performance, makes predictions more stable but slows down the model.
- max_features – maximum number of features random forest considers to split a node.
- min_sample_leaf – minimum number of leaves to split an internal node.
Parameters that determine the speed of the model
- n_jobs – how many processors the model can use.
- random_state – makes the output replicable.
- oob_score – random forest cross validation method.
Part C: Random Forest Model in R
The Dataset
The dataset comprises of details of customers to whom a bank has sold a credit card. The link to the dataset is provided at the end of the blog. The parameters given in column are:
– customer id
– age
– sex
– region
– income
– married
– number of children
– car (if they have)
– if they have a savings account
– if they have a current account
– if they bought a credit card
Our objective is to make a model to predict whether a customer will buy a credit card.
Originally posted here