

Dealing with Outliers is like searching a needle in a haystack
This is a guest repost by Jacob Joseph.
An Outlier is an observation or point that is distant from other observations/points. But, how would you quantify the distance of an observation from other observations to qualify it as an outlier. Outliers are also referred to as observations whose probability to occur is low. But, again, what constitutes low??
There are parametric methods and non-parametric methods that are employed to identify outliers. Parametric methods involve assumption of some underlying distribution such as normal distribution whereas there is no such requirement with non-parametric approach. Additionally, you could do a univariate analysis by studying a single variable at a time or multivariate analysis where you would study more than one variable at the same time to identify outliers.
The question arises which approach and which analysis is the right answer??? Unfortunately, there is no single right answer. It depends for what is the end purpose for identifying such outliers. You may want to analyze the variable in isolation or maybe use it among a set of variables to build a predictive model.
Let’s try to identify outliers visually.
Assume we have the data for Revenue and Operating System for Mobile devices for an app. Below is the subset of the data:
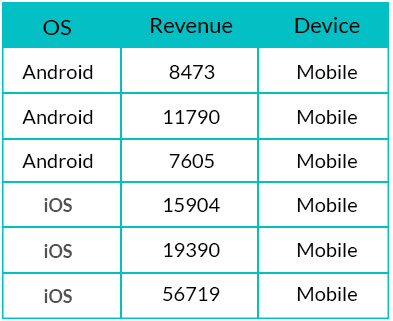
How can we identify outliers in the Revenue?
We shall try to detect outliers using parametric as well as non-parametric approach.
Parametric Approach
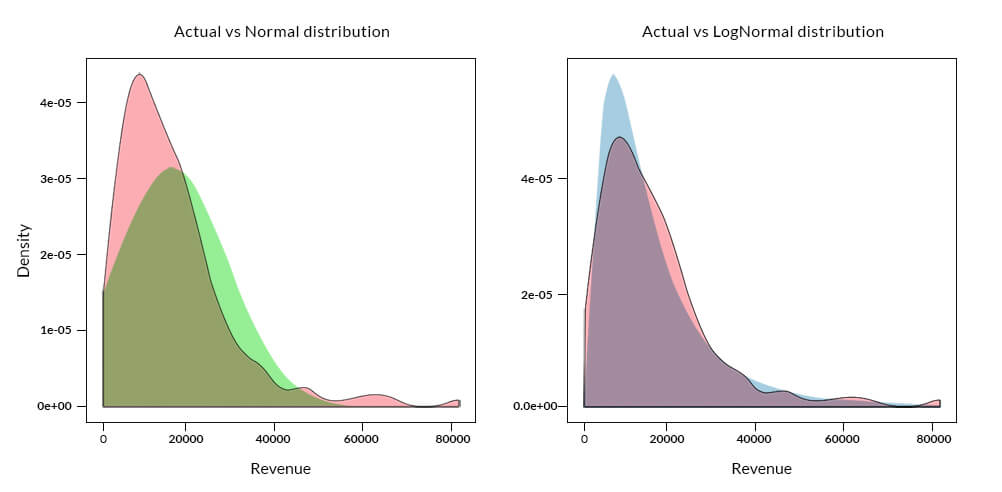
The x-axis, in the above plot, represents the Revenues and the y-axis, probability density of the observed Revenue value. The density curve for the actual data is shaded in ‘pink’, the normal distribution is shaded in ‘green’ and log normal distribution is shaded in ‘blue’. The probability density for the actual distribution is calculated from the observed data, whereas for both normal and log-normal distribution is computed based on the observed mean and standard deviation of the Revenues.
Outliers could be identified by calculating the probability of the occurrence of an observation or calculating how far the observation is from the mean. For example, observations greater/lesser than 3 times the standard deviation from the mean, in case of normal distribution, could be classified as outliers.
In the above case, if we assume a normal distribution, there could be many outlier candidates especially for observations having revenue beyond 60,000. The log-normal plot does a better job than normal distribution, but it is due to the fact that the underlying actual distribution has characteristics of a log-normal distribution. This could not be a general case since determining the distribution or parameters of the underlying distribution is extremely difficult before hand or apriori. One could infer the parameters of the data by fitting a curve to the data, but a change in the underlying parameters like mean and/or standard deviation due to new incoming data will change the location and shape of the curve as observed in the plots below:

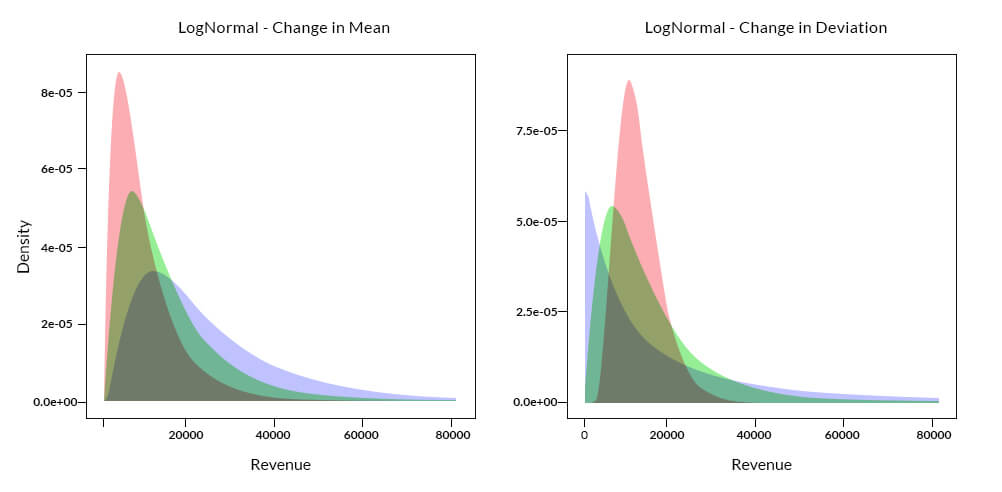
The above plots show the shift in location or the spread of the density curve based on an assumed change in mean or standard deviation of the underlying distribution. It is evident that a shift in the parameters of a distribution is likely to influence the identification of outliers.
Non-Parametric Approach
Let’s look at a simple non-parametric approach like a box plot to identify the outliers.
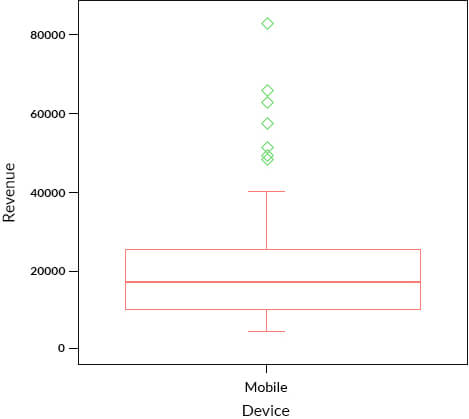
In the box plot shown above, we can identify 7 observations, which could be classified as potential outliers, marked in green. These observations are beyond the whiskers.
In the data, we have also been provided information on the OS. Would we identify the same outliers, if we plot the Revenue based on OS??
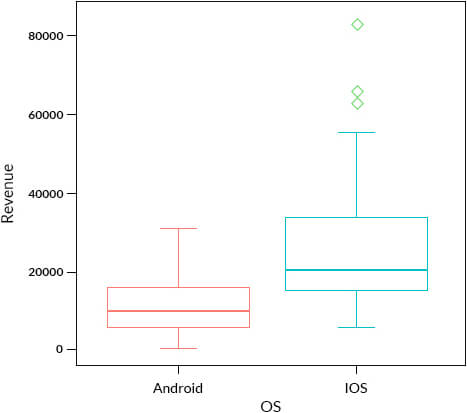
In the above box plot, we are doing a bivariate analysis, taking 2 variables at a time which is a special case of multivariate analysis. It seems that there are 3 outlier candidates for iOS whereas there are none for Android. This was due to the difference in distribution of Revenues for Android and iOS users. So, just analyzing Revenue variable on its own i.e univariate analysis, we were able to identify 7 outlier candidates which dropped to 3 candidates when a bivariate analysis was performed.
Both Parametric as well as Non-Parametric approach could be used to identify outliers based on the characteristics of the underlying distribution. If the mean accurately represents the center of the distribution and the data set is large enough, parametric approach could be used whereas if the median represents the center of the distribution, non-parametric approach to identify outliers is suitable.
Dealing with outliers in a multivariate scenario becomes all the more tedious. Clustering, a popular data mining technique and a non-parametric method could be used to identify outliers in such a case.