
Mortality and co-morbidity Investigation in Italy under Covid-19
Dispensing connection between characteristic, co-morbidities, and mortality outcomes among 1890 patients with Covid-19 and three cause of death: infectious, respiratory and under investigation diseases which affected mortality rates in Italy between 2010 and 2017.
by Federica Gazzelloni
Objective: To investigate the impact of Covid-19 in patients experiencing co-morbidities and verify connections among confirmed severe acute respiratory syndrome Coronavirus 2 (SARS-CoV-2) infection by positive result on polymerase chain reaction testing of a nasopharyngeal sample mortality and connecting Italians mortality rates between 2010 and 2017.
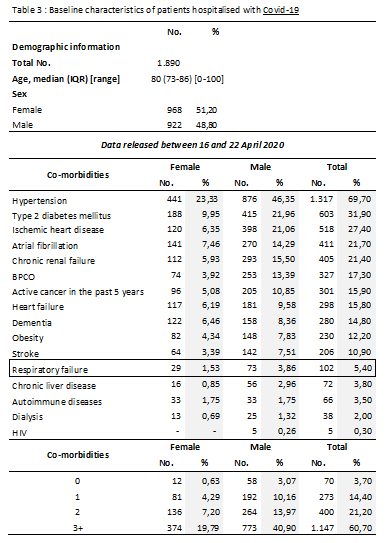
RESULTS A total of 1890 patient were included in the sample (median age for patients deceased and positives at Sars-Cov-2, 80 years [interquartile range – IQR , 73-86; range, 0-100 years]; 35,8% female). The most common co-morbidities were hypertension (1317; 69,7%), Type 2 diabetes mellitus (603; 31,9%), and Ischemic heart disease (518; 27,4%). At triage, 92,6% of patients were diagnosed with pneumonia, and other conditions such as respiratory rate greater than 24 breaths/minute, 75% fever, 72% dyspnoea, 38% cough, 6% diarrhea, 1% emottisi and only 6% were asymptomatic. The rate of respiratory failure was 96,7% the most common observed in this champion, followed by acute kidney damage 22,6%, virus co-infection was 12,7% and acute myocardial damage 9,3%.
Outcomes were assessed for the same sample size of 1890 patients who were positives at Covid-19 when they have died. During the investigation of the impact of causes of deaths in multi-collateral conditions, the percentage of respiratory system disease averaged in 8 Years-time, in Italy resulted higher than the percentage of patients experiencing respiratory failure as a co-morbidity factor and died under Covid-19 in Italy, data up to 24 of April 2020. More investigation on about probabilities values of dying with Coronavirus infection (Sars-Cov-2) resulting with a range of hope for those affected with respiratory system disease while affected of Covid-19.
CONCLUSIONS AND RELEVANCE This case provides characteristics and early outcomes of mortality rate changes in relation with patients with confirmed COVID-19 in Italy area.
The impact of Coronavirus outbreak on mortality trend is one important cause of death in 2020. The first two confirmed case of Coronavirus disease 2019 (COVID-19) were reported in Rome, Italy on January 31, 2020. Right after the first numbers of cases exploded in Wuhan, province of Hubei, China. Hospitalization team of Spallanzani, important Hospital in Rome, isolated the virus found in the blood cells of the patients, describing nature of it, and matching a future successful cure and advise. Since the begin of the outbreak, Italy registered an increase in numbers of new daily cases of 50% in February, 16% in March, with an overall rate of speed of infection R0=[0.15-2.2] , mostly in the North of Italy. The Region of Lombardy first, and Veneto straight after, placed Italy at the second place on the list of World Countries for numbers of infections. Within a month the infection took place very successfully, and reached the south of the Country, where it has been contained somehow. The lost of Doctors and nurses, at service for the Pandemic containment duties, is still under threat for scarcity in self protection products; this pandemic is the highest ever registered explosion of infective disease since the World War I, the time of the pandemic flu in 1918.
Thoughts focused upmost on sustainment for illness people, who required, and still are under request of artificial breathing machinery needs, as their breath shortening, resulted as the principal claim the consequence of Coronavirus-Sars-Cov-2. Numbers of patients increased drastically with increasing the primary need of oxygen with shortages consequences for the entire Health system. At today the numbers of patients requiring artificial breath sustainment has reduced drastically, it is expected to stabilize right after the phase II, on the 4 of May 2020.
Methods: The study was conducted with data provided by ISS – Superior Institute of Sanity and ISTAT – Institute of Statistics, reporting database and analysis performed using Excel and R programming language. Historical data-series were provided by ISTAT repository included Italian population mortality rates for three main cause of deaths, infectious diseases, respiratory system disease and causes still under investigation at 2017; all data collected from 2010 to 2017, female and male residents in Italy.
Considered probabilities of dying for three selected causes between 2010 and 2017, and then matched with mortality incidence of Covid-19 in 2020. The probability of dying because of one each of the selected cause of death results on matching with probabilities of dying under the cause of Covid-19, while experiencing co-morbidities of the same factors slightly increase the chance to get an infectious disease.
Key points: Probabilities were calculated using Bayesian theorem while descriptive statistics calculated under a reduced sample population,
used a chain index, an index number in which the value of any given period is related to the value of its immediately preceding period (resulting in an index for the given period expressed against the preceding period = 100) for annual changes, this index type is called a chain index because individual indices with previous period = 100 can be chained together by multiplying (and dividing by 100) all consecutive indices, thus converting them into a series of indices with the first reference period = 100. This way, the consecutive values of the index numbers form a chain, as it were, from the first (reference) to the last period,
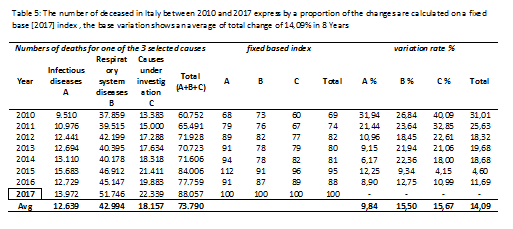
and a fixed-base index, where the value of every period in a time series is directly related to the same value of one fixed base period, used 2017 as a base.
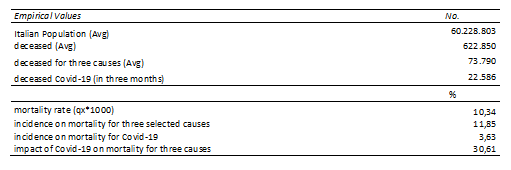
The information provided by the data available explains the changes in mortality rates for Italy in 2020. In particular, for those who died under specified conditions and classified as died for infectious disease, respiratory illnesses and still under investigation between 2010 and 2017 has been carried a comparison analysis in connection with co-morbidities factors found under Covid-19 outbreak in Italy. The size of the Italian population has been taken into account to identify the sample-size to compare mortality rates. Evidences below, show the probability of dying for one of each of the three selected causes (8-Year Avg value) while experiencing co-morbidities, identify an expected value of 36% of dying for an infectious disease while experiencing 3+ co-morbidities, and it results lower than the percentage of dying for Covid-19 while experiencing multi-collateral conditions.
In this study, the population, sized at the end of the years between 2010 and 2017, used in this study to calculate the CDR (Crude Mortality Rate), identify the percentages of the impact of the three causes on standards mortality rate, and consequently the mortality rates under Covid-19, and the impact on Italian mortality for 2020 (data-frame at 23 of April 2020).
The identification of the sample, in which the study will identify target probabilities takes consideration of two hypothesis in which are included part of the total laboratory confirmed cases, registered between 16 and 22 of April, for Covid-19 infections, and a paired sample of the average number of deceases in 8 Years in Italy, as shown below: 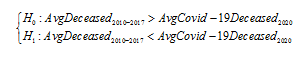
In the above table, the number of deceased with Covid19 is restricted at three months time and considered as exhaustive in this study, it is not expected to rise further. In the negative hypothesis the numbers of death will continue for the rest of the Year, 30,61% can be considered a quarter of the total deaths expected at the end of the Year. Most important are measure of containment of the virus to do not get into this limited condition.
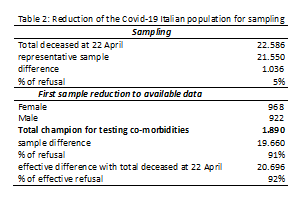
The following table 2 shows the sample size, chosen as reduced population of deceased to available data provided by ISS at 22 of April 2020, with aggregate demographics data, that will be used to make the calculation of the probabilities. The champion identify a sub-sub population, a sub-champion of 1.890 individual, female 51% and male 49% with 16 different types of co-morbidities, subdivided by numbers and percentage of incidence on total as data retrieved directly in the Hospitals by the ISS subsidiaries and published on Epicentro.iss.it web-site.
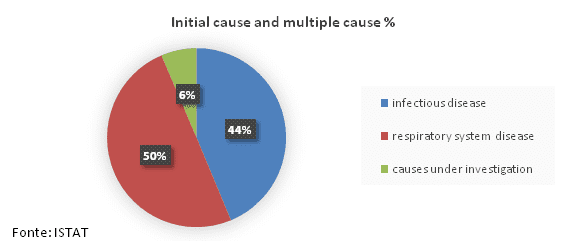
Demographics in table 3 list female, male and total numbers of patients deceased for Covid-19 experiencing co-morbidity factors, 70% of the deceased had hypertension as co-morbidity factor, followed by 32% with diabetes type 2 and 27% ischemic heart disease. Respiratory failure results just with 5,4% of the patients, on a sample of 1.890 registered patients. This is a very important evidence; just a little part of the sample had previous experienced respiratory failures; characteristics of Covid19 disease is the requirement for artificial respiratory sustainment, although results of data collection evidence other preconditions as the mostly found within patients who died with Covid19, it was expected the factor of respiratory failure to be within the first co-morbidities on the list. The second part of the table shows clearly the number of co-morbidities as to be 3+ causes of deaths (60%) in addition to Covid-19 illness as the reason for dying.
In this study, the factors of respiratory failure and respiratory system diseases, will be considered and matched with mortality values of Italian population between 2010 and 2017, and the average values of the people who died for this causes, as a co-morbidity factor, will be taken into consideration with other two factors: infectious disease and other causes still under investigation.
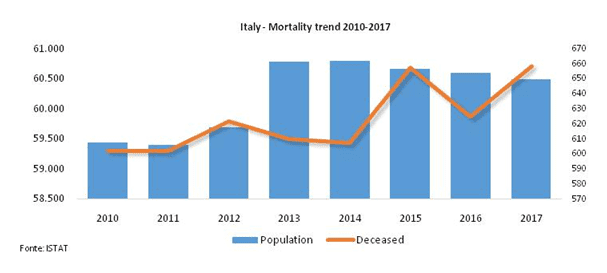
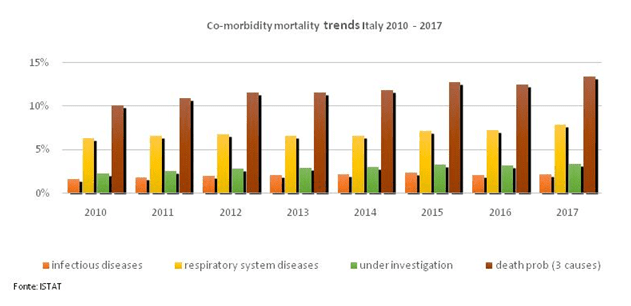
Two graphs (graph 1 and 2) of the Italian population between 2010 and 2017 show the mortality trend and the level of impact of the selected causes.
Graph 1: The mortality trend in Italy between 2010 and 2017 shows an increase between 2014 and 2015 to then decrease in 2017. (Population per million, deceased in thousands)
Graph 2: Co-morbidity impact on Italian population, the graph clearly evidence the highest level of mortality among the three causes as respiratory system diseases, followed by causes still under investigation and as a third cause, infectious diseases
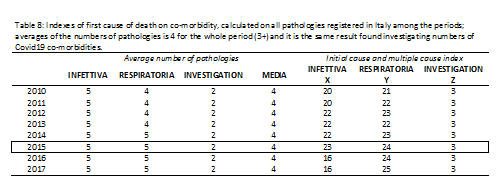
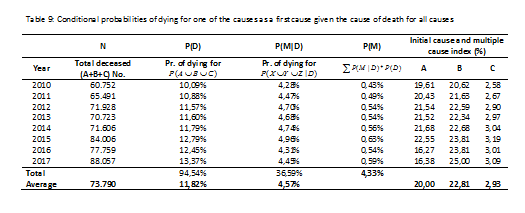
The following table 4 shows the composition of a side of the Italian population who died for three causes object of the study, and the probabilities split within 8 years. Researched are connections with multi-collateral factors in patients who have died with Covid-19 in Italy. The study will not take consideration of the percentage of the people who died for other factors.
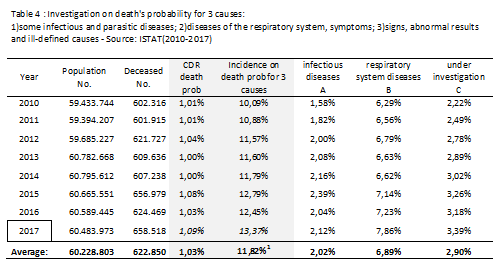
CDR is calculated dividing the number of deceased by Italian population for each Year, then the death probability for 3 causes is given by the sum of the three probabilities of dying for a single cause. As it can be noted the difference in rates is due to the different impact on total population and the number of deceased. For the Year 2017, which it will be taken into consideration as a base Year, results are 1,09% CDR (Crude Death Rate of mortality) calculated on the total population, 13,37% is the percentage of death for all of the three causes, and it is calculated on the numbers of deceased for the same Year.
Formulation of the fixed based index is : 
To be specified is that the variation is absolute, it doesn’t take consideration if it is an increase or a decrease.
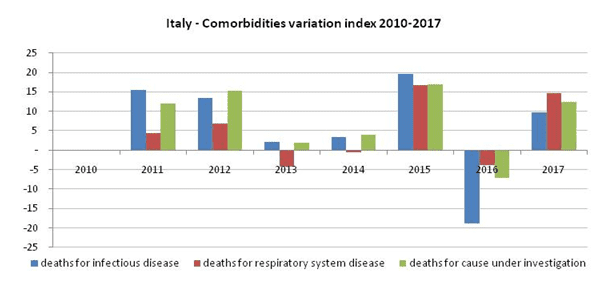
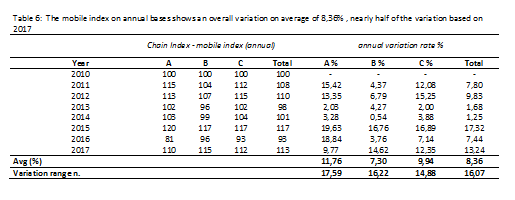
On overall, an increase of mortality has been identified in 2017 in comparison with the others Year; it can be identified, for all the Years between 2010 and 2016 compared with 2017, a lower value, except for the Year 2015 cause A, for which results an index of 112; indexes above 100 have registered increases compared to the base Year [2017], viceversa the opposite. The last column shows the variation in percentage values. The last table about variation, table 6, shows the annual variation starting from 2010, it evidences an average variation value of 8,36%, major changes are registered for infectious diseases (cause A) with a variation range of 18, and between the Years 2012 and 2013, 2014 and 2015, it can be seen that infectious diseases stabilising trend is every two Years. Conversely, cause B, Respiratory system diseases show a steady trend with an important variation between 2015 and 2017; the last cause C, are causes still under investigation, because of symptoms, signs still unrecognised, analysed period (2010-2017) results with a very similar trend to those ones of the cause A, just a slight difference can be evidenced in 2016 where the cause C matches the trend of cause B, and viceversa.
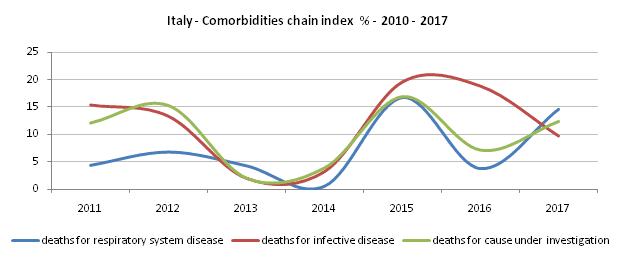
Other two graphs show the results of the chained variations in the mortality trend for Italian population between 2010 and 2017.
Results evidence chained values of any given period as related to the value of its immediately preceding period, showing a gap changes; the highest level has been registered in 2015 values of mortality for infectious disease compared to previous Year.
Chain Index (annual), it is calculated as the ratio of two consecutive value of mortality: 
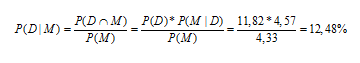
Theorem of Bayes can absolutely be used to model the probabilities, or the distribution of probability of getting infected within co-morbidity conditions. The conditional probability of dying for an infectious disease, given the probability of having died for multi-conditional diseases, takes consideration of the one factor disease on multi-collateral ones; the indexes, among a range of time of 8 years (2010-2017) are the starting point to evaluate the index obtained under Covid-19 in 2020.To calculate the probability that the cause A verify given the cause B, it has been used an application of the theorem of Bayes: 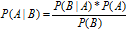
The conditional probability of the verifying of the event cause B is conditional at event cause A, the events are independents. It is important to specify that in the calculation of the probability P(A|B) the events are not independents, the patient has died for an infectious disease while he was already infected with cause of death B. In this second part of the formulae event B is independent by the verify of the cause A.
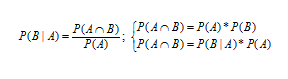 whether events are independents or not
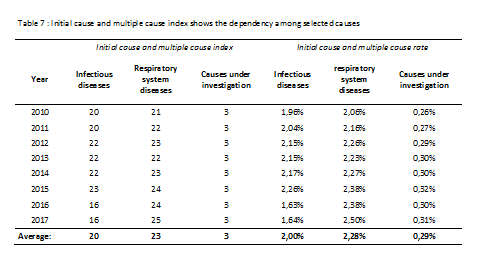
The probability of dying for infectious disease, respiratory system disease or other causes under investigation as first cause is conditional to the probability of dying for one of the causes.
CONCLUSIONS AND RELEVANCE This case provides characteristics and early outcomes of mortality rate changes in relation with patients with confirmed COVID-19 in Italy area.
The analysis put a warning on value of respiratory failure (5,40% in table 3) registered within hospitalised patients under Covid-19 in Italy 2020, compared to the standard values disclosed by ISTAT database for Italy and resumed as expected values obtained on average between 2010 and 2017. In 8 years time-frame respiratory system disease have impacted mortality rates for 6,89%, as shown in table 4. The average value results higher than the value in percentage resulted by Covid-19 patients hospitals data-retrieval. The difference of 1,49 is the range of decrease in respiratory failure for a disease which is mainly affecting respiratory system?
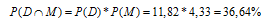
The calculation of the independent conditionality of being death for an infectious disease while it is the first cause of death is 36,64% and it results in line with three months of mortality rate for Covid-19 Italy.
More research need to be done in terms to identify the best combination for reducing risks associated with an infectious disease.
[1] Estimation of the error in the calculation of the mortality rate in table 1 (11,85%) and here in table 4 (11,82%) would be treated in the next study, the difference of 0,03 due to gross round is not a percentage and will be considered as an error in case of studying the impact of error estimation.