
Imagine you are a company selling a fast-moving consumer good in the market.
Let’s assume that the customer would follow the given journey to make the final purchase: 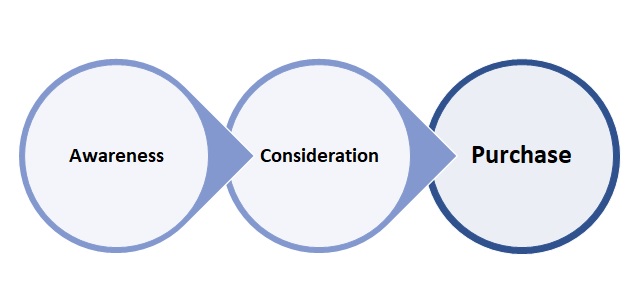 These are the states at which the customer would be at any point in the purchase journey.
Now, how to find out in which state the customers would be after 6 months?
Markov Chain comes to the rescue!!
Let’s first understand what Markov Chain is.
Markov Chains:
A Markov chain is a stochastic model describing a sequence of possible events in which the probability of each event depends only on the state attained in the previous event
- Markov Chains are sequential events that are probabilistically related to each other.
- These events are also known as states
- These states together form what is known as State Space.
- The probability of next event or next state depends only on the present state and not on the previous states. This property of Markov Chain is called Memoryless property. It doesn’t care what happened in the past event and focuses only on the present information to predict what happens in the next state
Markov Chain – States, Probabilities and Transition Matrix
Let’s delve a little deeper.
A Markov Chain provides:
- Information about the current state
&
- Transition probabilities of moving from one state to another
Using the above two information, we can predict the next state.
In mathematical terms, the current state is called Initial State Vector.
So, what we get is:
Final State = Initial State *Transition Matrix
Classic Example
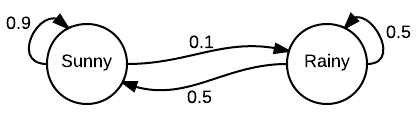
A classic example of Markov Chain is predicting the weather. We have two different weather conditions: Sunny and Rainy. Let’s assume today it is sunny. We have the following probabilities:
- Probability of being sunny tomorrow (Probability of being in the same state) given that it is sunny today: 0.9
- Probability of raining tomorrow given that it is sunny today: 0.1
- Probability of being sunny tomorrow (Probability of being in the same state) given that it is rainy today: 0.5
- Probability of raining tomorrow (Probability of being in the same state) given that it is raining today: 0.5
Source: Wikipedia
Here the initial vector is =

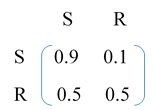
Transition Matrix =
 Weather on Day 2 =
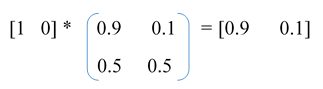
Recollect the Final State = Initial State *Transition Matrix? The above represents the same.
So, what is the inference?
There is a 90% chance that the weather will be sunny on Day 2 and 10% chance that it will rain.
Back to the Problem
Coming back to the problem where we need to know what the state the customer is after 6 months of launching the product.
We can assume there are 4 states in which the customer can be at any point in time.
- Awareness
- Consideration
- Purchase
- No Purchase
We have the following information:
- Total no. of customers = 200,000
- The no of customers in each state/category
- The transition probabilities of moving from one state to another state
- Information about running some campaign in these months (The aim of the campaign is to increase no. of customers purchasing the product)
The Marketing Analytics objective:
- To get no. of customers in all 4 states after 6 months
- To assess whether the campaign was effective in increasing the no. of customers purchasing the product
So, lets dive into the math part.
Note: A – Awareness, C – Consideration, P – Purchase, NP – No Purchase
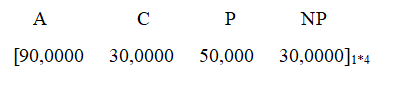
Initial State Vector =

Transition Matrix = 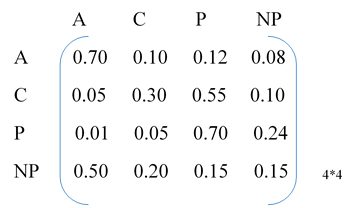
It would be clearer to see the movements among all 4 states diagrammatically.
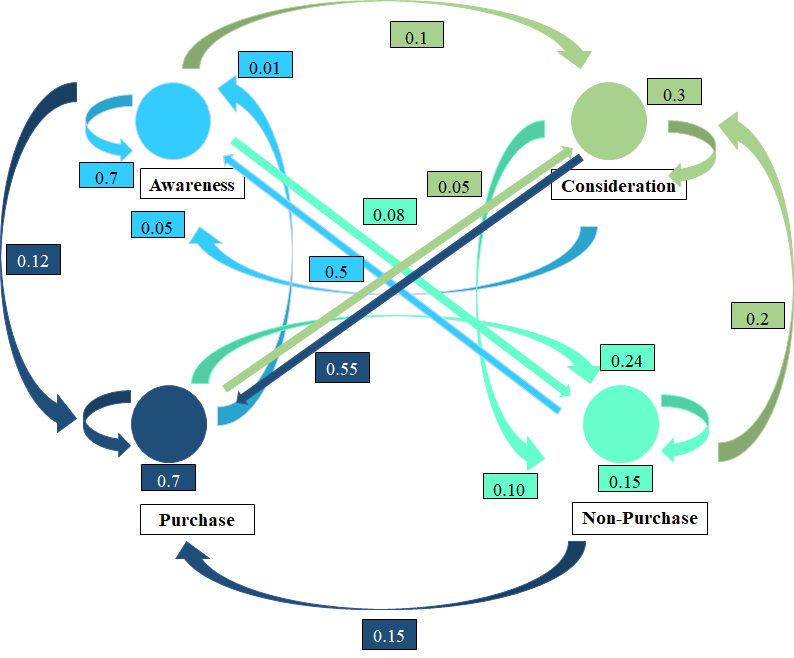
Final States of Customers = Initial State Vector * Transition Matrix

Evaluation of the Result
Now let’s evaluate our results.
Initial Vector
Final Vector
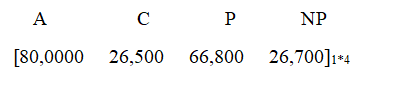 We can notice that the number of people under ‘Awareness’ and ‘Consideration’ have decreased. This is a good thing because, the people actually shifted from the state of ‘Awareness’ and ‘Consideration’ to the state of ‘Purchase’ (an increase of nearly 34% !!) Also notice that the number of people in ‘No Purchase’ states decreased (a decrease of 11%).
Overall our analysis goes to show that the campaign/ads has worked!!
Markov Chain has many other applications in Marketing Analytics and other fields such as NLP.
Stay tuned for more articles….