
At first glance, the Lognormal, Weibull, and Gamma distributions distributions look quite similar to each other. Selecting between the three models is “quite difficult” (Siswadi & Quesenberry) and the problem of testing which distribution is the best fit for data has been studied by a multitude of researchers.
If all the models fit the data fairly well, many techniques are at your disposal to differentiate between models including the maximum likelihood method and many different hypothesis tests.
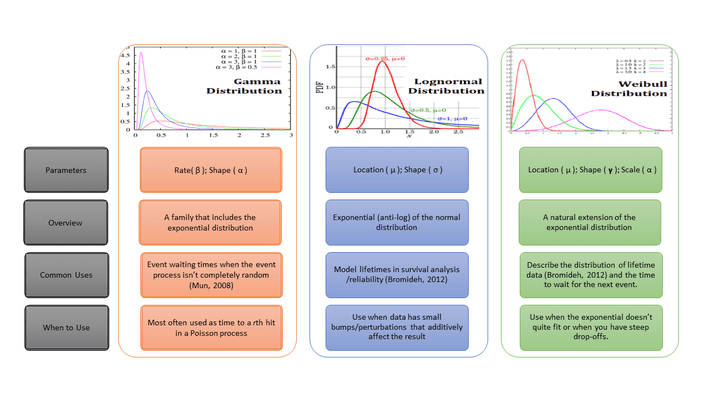
Despite their similarities, there are some subtle differences between the Lognormal, Weibull, and Gamma distributions. This one picture outlines the differences between the three models.
More information:
References
Bromideh (2012) DISCRIMINATING BETWEEN WEIBULL AND LOG-NORMAL DISTRIBUTIONS BASED O…
Mun (2008) Understanding and Choosing the Right Probability Distributions
Weibull vs Lognormal Data Analysis
Gamma Distribution image: CBurnett|Wikimedia Commons
Lognormal image: Krishnavedala|Wikimedia Commons