
Unsplash image
Students at Delft University of Technology, the Netherlands carried out a crowdsourcing study as part of the Crowd Computing Course designed by Asst. Prof. Ujwal Gadiraju and Prof. Alessandro Bozzon around one key challenge the creation and consumption of (high quality) data. Course participants presented several brilliant group projects at the Crowd Computing Showcase event held on 06.07.2021. The group consisting of Xinyue Chen, Dina Chen, Siwei Wang, Ye Yuan, and Meng Zheng was judged to be among the best. The details pertaining to this study are described below.
Background
Saliency maps are an important aspect of Computer Vision and Machine Learning. Annotating saliency maps, like all data labeling, can be done in a variety of ways; in this case, crowdsourcing was used since it is considered to be one of the fastest methods. The goal was to obtain annotated maps that could be used to acquire a valid explanation for model classifications. Four task designs were used in the experiment.
Method
Preparation
As a first step, an ImageNet-pretrained Inception V3 model was used to extract saliency maps from original images. The maps were subsequently fine-tuned using CornellLabs NAbirds Dataset that contains over 500 images of bird species. 11 of those were selected for the project. SmoothGrad was used to minimize noise levels.
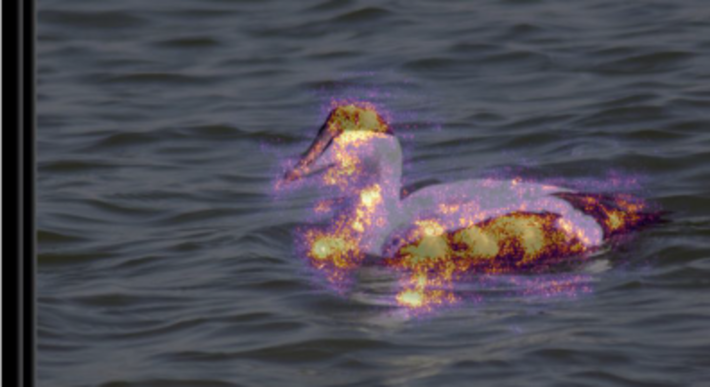
Fig. 1 Example image of a saliency map
Experimental Design
Four types of tasks were used in the course of the experiment: one control task that became the baseline and three experimental tasks. Those three were: training, easy tagging (ET), and training + ET. Each task consisted of 74 images that took approximately three minutes to process. Each saliency map was annotated by three different crowd workers.
Task: Baseline
Three functional requirements had to be met in this part of the experiment:
- Instruction the crowd performers understanding of the instructions.
- Region selection the performers ability to correctly use the interface tools to mark highlighted areas.
- Text boxes the performers ability to use the input boxes appropriately to enter relevant information.
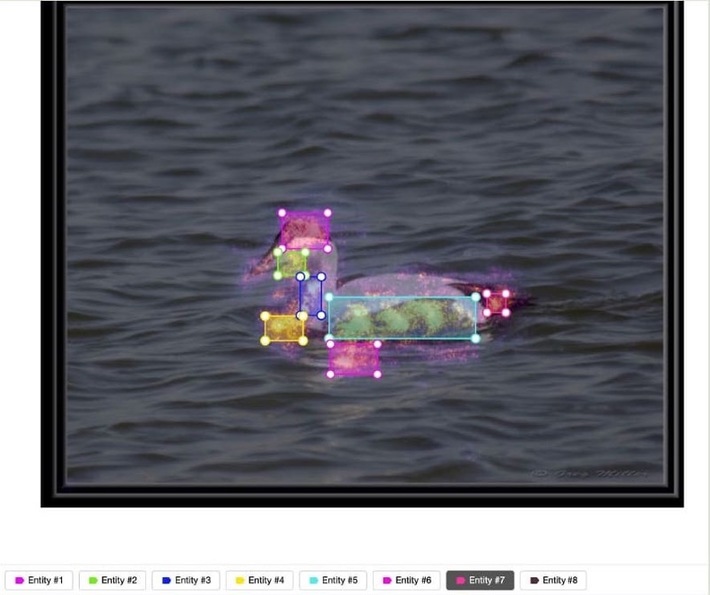
Fig. 2 Baseline interface
Task: Training
The performers were asked to complete a set of training tasks that were designed using Toloka, a crowdsourcing platform. A training pool with three 3-minute tasks was created. The performers had to finish all of the tasks with a minimum accuracy of 70% in order to proceed to the experimental tasks. After this was achieved, the main study began.
Task: Easy Tagging (ET)
As part of the experimental task, the crowd workers had to recognize and label various body parts of bird species. To do that, a picture was provided as a reference. Since the study groups pilot study demonstrated that color had remained among the most common characteristics, color checkboxes were provided to make color attribute annotations easier for the subjects. In addition, all input boxes contained both suggestion and free input options, such as when the performers wished to annotate non-color attributes, or the colors provided in the answer box did not match the colors displayed in the image.
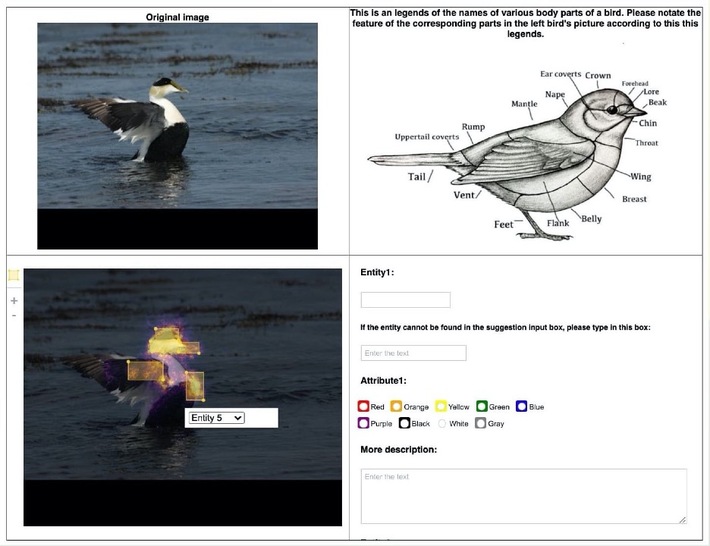
Fig. 3 Easy Tagging Interface
Quality Control
Quality control mechanisms were consistent across all four tasks. The performers were asked to use only desktops or laptops during the study to make sure that labeling objects with the bounding boxes was easy and done in the same way throughout. In addition, all of the subjects were required to have secondary education and be proficient in English. Captcha and fast response filtering were used to filter out dishonest workers. The answers were checked manually and accepted based on the following criteria:
- At least one bounding box was present.
- At least one pair of entity-attribute descriptions was present.
- The indices of the bounding boxes had to correspond to the indices of the offered descriptions.
Evaluation Metrics
- IOU Score
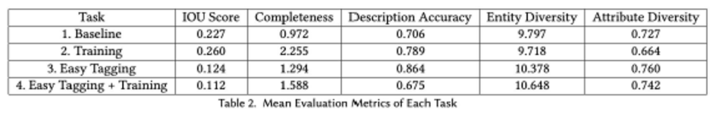
Intersect Over Union was used to evaluate the accuracy of the bounding boxes. It is calculated by dividing the intersect area of two bounding boxes by the area of the union. The final IOU score is a composite average of multiple IOU values.
- Vocabulary Diversity
This metric consists of two values: entity diversity (number of distinct words), and attribute diversity (number of adjectives used to describe one entity).
- Completeness
This metric pertains to how complete an annotated saliency map is. It is calculated by dividing the value of the annotated saliency patches by the value of the ground truth annotations.
- Description Accuracy
This metric represents a percentage of valid entity-attribute descriptions. The value is calculated by aggregating and averaging the results from three different crowd workers.
- Accept rate
This metric is calculated by dividing the number of accepted annotations by the total number of submissions.
- Average Completion Time
This metric reflects average duration values of the annotation tasks.
- Number of Participants
This metric pertains to the total number of distinct crowd workers participating in the experiment.
Results
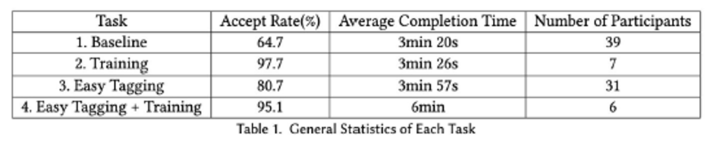
- The average completion time for all tasks was 3 minutes as predicted.
- The mean IOU score was lower in tasks 3 and 4 compared to 1 and 2. This is likely to be the result of the interface differences since the bounding boxes in tasks 3 and 4 contained only one color.
- The difference between the mean IOU scores of tasks 1 and 2 is statistically significant (p=0.002) and is in favor of task 2. The difference between the IOU scores of tasks 3 and 4 is not statistically significant (p=0.151).
- Training significantly increased completeness (p=0.001). Likewise, easy tagging also raised completeness levels from the baseline values.
- No statistically significant difference in entity diversity was observed between tasks 1 and 2 (p=0.829) and tasks 3 and 4 (p=0.439). This was expected since vocabulary diversity was not specifically covered in the training phase.
- Training showed to significantly improve description accuracy compared to the baseline values (p=0.001).
- Accuracy was increased significantly as a result of the easy tagging interface (p=0.000).
- From the within-interface perspective, the difference in attribute diversity of tasks 1 and 2 was statistically significant and in favor of task 1 (p=0.035), which implies that training tends to diminish baseline diversity. No statistically significant differences were observed between the attribute diversities of tasks 3 and 4 (p=0.653).
- From the between-interface perspective, a statistically significant difference was observed between tasks 2 and 4 that had different interfaces (p=0.043). This implies that training and interface design are interdependent.
Discussion
Two conclusions can be drawn from this study. One is that performance values depend on what type of interface is being used. In this respect, shortcuts can both help and hinder by either lifting some of the performers cognitive load or backfiring and making the performer too relaxed and unfocused. The second conclusion is that training can increase bounding box and description accuracy; however, it can also take away from the subjects creativity. As a result, requesters have to consider this trade-off before making a decision regarding task design.
Certain limitations of the study should also be taken into account. The most obvious one is that this study should have ideally been conducted as a between-group experiment. Unfortunately, this was not possible. The second limitation is a small number of participants in those tasks that required training. The values received thereafter are likely to be skewed as a result. The last major limitation has to do with applicability since only aggregated averages from across multiple granularities were used as the final values, these figures are not likely to accurately represent most non-experimental settings.
Since one of the findings suggests that input shortcuts can both increase accuracy and concurrently diminish creativity, future studies should look at different study designs with multiple shortcuts (e.g. shape and pattern). In this scenario, the negative side effect of decreased creativity and boredom may be countered with the more sophisticated interfaces that are practical and user-friendly. Finally, the authors propose a switch from written to video instructions as these will likely be more effective and result in a greater number of subjects finishing the training phase.
Project in a nutshell
Saliency maps are an integral part of MLs advance towards improved Computer Vision. On par with other forms of data labeling, annotating saliency maps is at the core of training models and their classification. Using crowd workers from Toloka and a dataset of birds from CornellLabs NABirds, this paper examined how crowdsourcing can be used in saliency map annotations. To do so, four types of tasks were used, of which one became the baseline, and the other threetraining, easy tagging (ET), and training/ETwere the main tasks. All of the crowd performers were recruited from the Toloka crowdsourcing platform. Several metrics were used for evaluation, including IOU score, vocabulary diversity, completeness, accuracy, accept rate, and completion time among others. Results showed that the choice of interface had a major effect on performance. In addition, training increased the bounding box as well as description accuracy but also diminished the subjects creativity. Implications of these findings and suggestions for future studies are discussed.