
This chart communicates the same insights as a contour plot. What is interesting is the choice of hexagonal buckets (rather than squares) to aggregate data. In fact, any tessellation would work, in particular Voronoi tessellations.
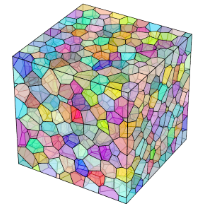
3-D Voronoi tessellation
The reason for using hexagons is that it is still pretty simple, and when you rotate the chart by 60 degrees (or a multiple of 60 degrees) you still get the same visualization. For squares, rotations of 60 degrees don’t work, only multiples of 90 degrees work. Is it possible to find a tessellation such that smaller rotations, say 45 or 30 degrees, leave the chart unchanged? The answer is no. Octogonal tessellationsdon’t really exist, so the hexagon is an optimum.
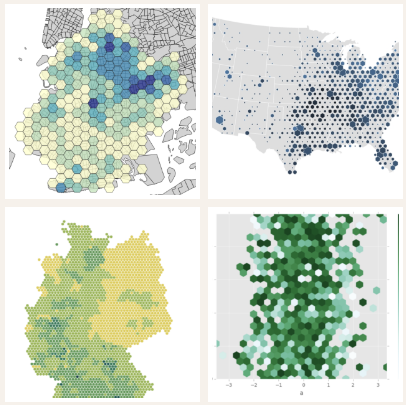
Hexagonal binning plots (source: here)
Implementation in R
The three plots described here (Voronoi diagram, hexagonal binning and contour plots) are available in the ggplot2 package.
- Hexagonal binning: ggplot function with the parameter stat_binhex, see here
- Contour plot: ggplot function with the parameters geom_point and geom_density2 or stat_contour, see here (also works with contour)
- Voronoi diagram: ggplot with the parameter geom_segment, see here
Applications
Voronoi diagrams can be used for nearest neighbor clustering or density estimation, the density estimate attached to a point being proportional to the inverse of the area of the Voronoi polygon containing it.
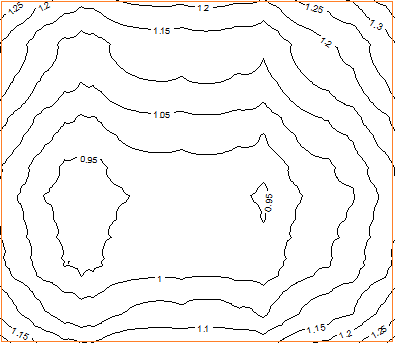
Example of contour map (source: here)
Originally posted here.