
This article was written by Will Koehrsen.
Here’s the complete code: just copy and paste into a Jupyter Notebook or Python script, replace with your data and run:
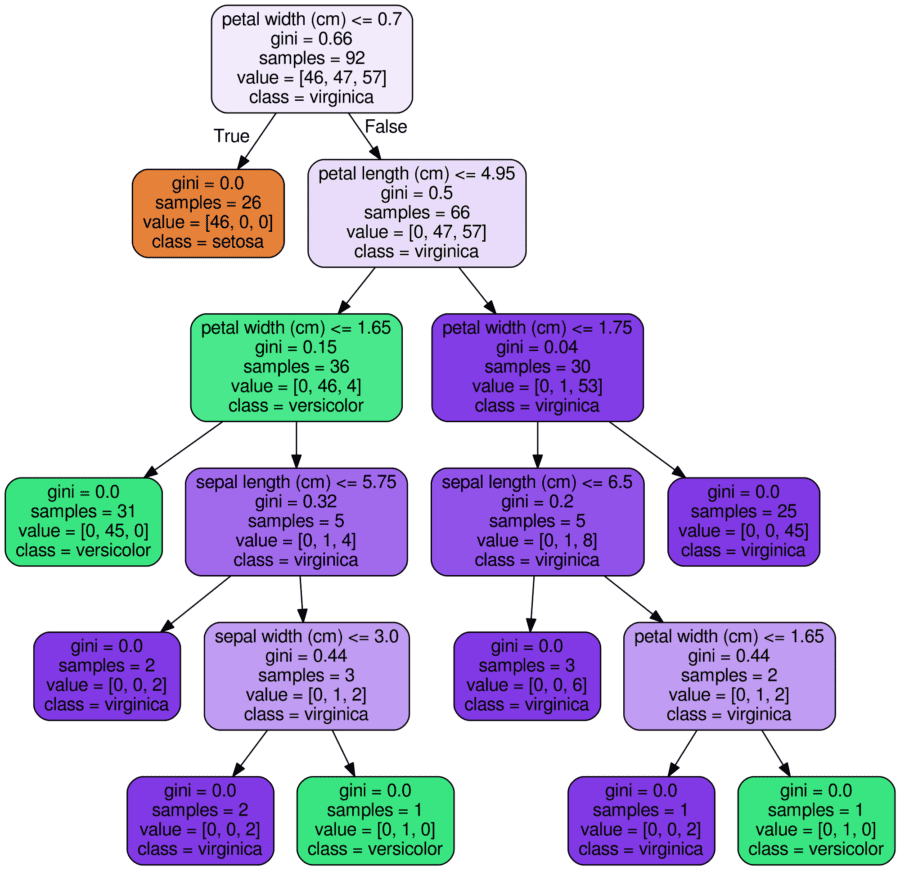
The final result is a complete decision tree as an image.
Explanation of code
- Create a model train and extract: we could use a single decision tree, but since I often employ the
random forest for modeling it’s used in this example. (The trees will be slightly different from one another!).
- Export Tree as .dot File: This makes use of the
export_graphvizfunction in Scikit-Learn. There are many parameters here that control the look and information displayed. Take a look at the documentation for specifics. - Convert
dottopngusing a system command: running system commands in Python can be handy for carrying out simple tasks. This requires installation of graphviz which includes the dot utility. For the complete options for conversion, take a look at the documentation. - Visualize: the best visualizations appear in the Jupyter Notebook. (Equivalently you can use
matplotlibto show images).
To read the rest of this article with code and illustrations, click here.
DSC Resources
- Book and Resources for DSC Members
- Comprehensive Repository of Data Science and ML Resources
- Advanced Machine Learning with Basic Excel
- Difference between ML, Data Science, AI, Deep Learning, and Statistics
- Selected Business Analytics, Data Science and ML articles
- Hire a Data Scientist | Search DSC | Find a Job
- Post a Blog | Forum Questions