
This article was written by Luis Verde Arregoitia on his personal research page.
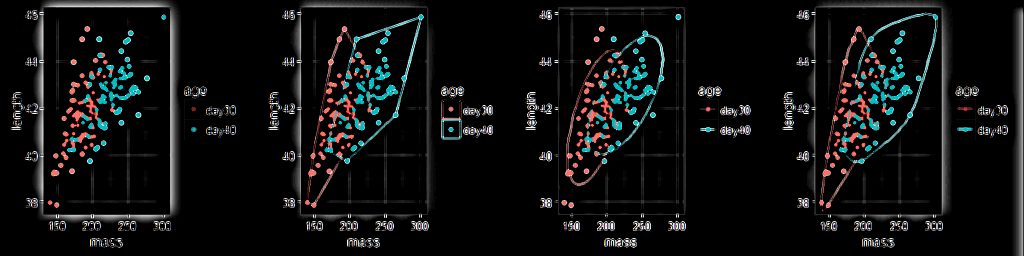
For various kinds of analyses, we often end up plotting point data in two dimensions for two or groups. This includes Principal Component Analyses, bioclimatic profiles, or any other combination of values on two axes. In some of my recent projects I’ve encountered three alternatives for drawing polygons around groups of points and I want to share code and examples for all three in this post.
These methods are for ggplot, but I assume there are ways to do the same things using base or other plotting engines. I wanted to use real data, so the following examples use data from thispaper on the physiology of the Japanese quail. After loading (or installing if necessary) the required packages and downloading the data directly from Dryad, we can wrangle the data so we can plot length and mass data from several individual birds at 30 vs 40 days of age.

To read more, click here.
DSC Resources
- Book and Resources for DSC Members
- Comprehensive Repository of Data Science and ML Resources
- Advanced Machine Learning with Basic Excel
- Difference between ML, Data Science, AI, Deep Learning, and Statistics
- Selected Business Analytics, Data Science and ML articles
- Hire a Data Scientist | Search DSC | Find a Job
- Post a Blog | Forum Questions
Follow us on Twitter: @DataScienceCtrl | @AnalyticBridge