

In my prior blog “Reframing Data Management: Data Management 2.0″, I talked about the importance of transforming data management into a business strategy that supports the sharing, re-using and continuous refinement of the data and analytics assets to derive and drive new sources of customer, product, and operational value. If data is “the world’s most valuable resource”, then we must transform data management into an offensive, data monetization business strategy that proactively guides organizations in the application of their data to the business to drive quantifiable financial impact (Figure 1).
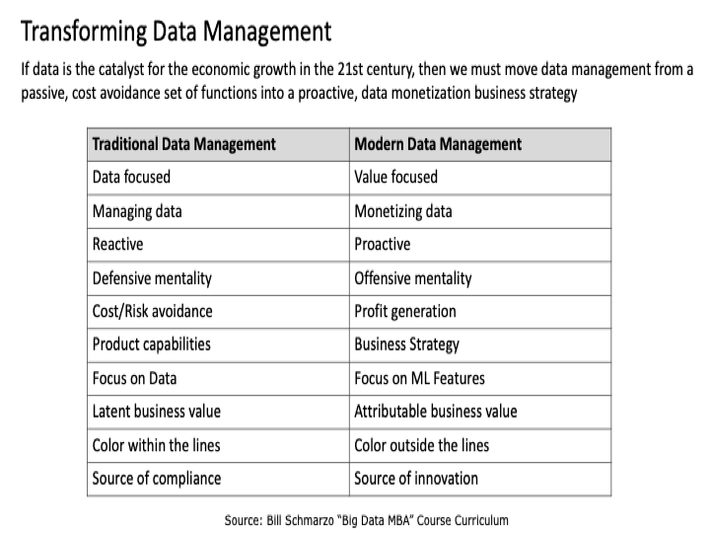
Figure 1: Activating Data Management
In this blog I want to drill into the importance of Machine Learning (ML) “Features”. Now, I have always found the term features a bit confusing. When we describe the features for a car, we talk about manufacturer, model, style, color, cruise control, lane departure warnings, blue tooth connectivity, and such. But when we talk features with respect to ML, it’s a bit more nuanced:
ML Features are the attributes, properties, or data variables that ML models use during training and inference to make predictions.
ML Features are the data variables that are most useful in making predictions that deliver quantifiable financial impact. For example, if we build an ML model to predict the survival rate of the Titanic passengers, the ML model would learn that “Title” and “Sex” are the most important features in predicting one’s likely survival (Figure 2).
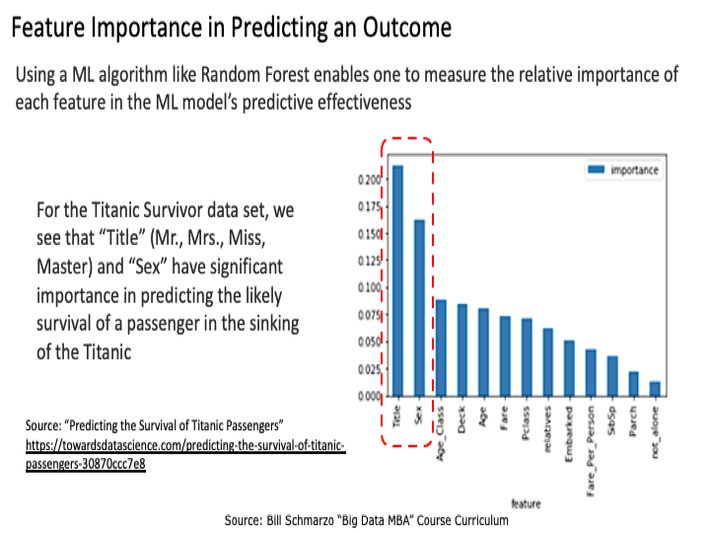
Figure 2: Source: “Predicting the Survival of Titanic Passengers”
The determination as to which ML Features to engineer is highly dependent upon a deep understanding of the problem the business is trying to solve; that is, what decisions they are trying to optimize and the KPIs against which they will measure decision progress and success.
Critical Feature Concepts
Feature Selection is the process of selecting a subset of relevant features (variables, predictors) for use in model construction. Feature selection techniques are used to:
- simplify models to make them easier to interpret by users
- shorten training times
- mitigate dimensionality which can reduce model performance
Feature Engineering is the process of blending domain knowledge with data science to engineer new data variables that can be used by ML models to make predictions in context of the problem being addressed. For a Retailer making decisions regarding in-store merchandising, the raw Data Elements of {customer_dob}, {item_purchased}, and {item_cost} from the Point-of-Sales system could be feature engineered into [Customer Age], [Total Number of Items Purchased], [Total Number of Book Purchases], [Total Money Spent], and [Percentage of Money Spent on Books].
From the book “Feature Engineering for Machine Learning: Principles and Techniques…” by Alice Zheng and Amanda Casari, we get the following Feature Engineering summary:
Machine learning fits mathematical models to data to derive insights or make predictions. These models take features as input. A feature is a numeric representation of an aspect of raw data. Features sit between data and ML models in the machine learning pipeline. Feature engineering is the act of extracting features from raw data and transforming them into formats suitable for the machine learning model. It is a crucial step in the machine learning pipeline because the right features can ease the difficulty of modeling, and therefore enable the pipeline to output results of higher quality. Practitioners agree that most of the time in building a machine learning pipeline is spent on feature engineering and data cleaning.
Key Feature Engineering activities include:
- Data integration, the most basic Feature Engineering capabilities, combines data from different data sources to create new variables.
- Normalization and Standardization, two terms sometimes used interchangeably, but refer to different things. Normalization means to scale a variable to have values between 0 and 1, while standardization transforms data to have a mean of zero and a standard deviation of 1 (a z-score).
- Data Blending, a process where data from multiple sources are merged into a single data set in a non-permanent format to determine the predictive value of the blended metrics.
- Data enrichment, which merges third-party data with internal data sources to enhance the predictive capabilities of the data.
- Creation of Composite metrics.
Composite Metrics are a higher-level metric created through mathematical transformations and combinations of raw data elements. For example, Body Mass Index (BMI) is a higher-order, composite metric calculated as the person’s body mass (weight) divided by the square of the person’s height times 703 and is expressed in units of pounds/inches² (BMI = weight (lbs) / [height (in)]2 x 703). BMI is used (and reused) by multiple ML models for different use cases including predicting one’s likelihood of developing diabetes, one’s risk of a stroke or heart attack, or supporting diet and exercise recommendations. Probably the most common “composite metric” is a FICO Score, which is comprised of over 30 metrics that are weighted in a way as to yield the best predictor of an individual’s ability to repay a loan.
A Feature Store is a data repository that allows data scientists and data engineers to store, share, and reuse a curated library of features for their ML model development. Feature stores aid in implementing traceability along with compliance and scalability from data source to final ML model outcome. The feature store concept was originally developed by Uber with its Michelangelo machine learning platform.
Before Michelangelo, Uber faced a multitude of challenges building and deploying ML models related to the size and scale of their operations. While data scientists were using a wide variety of tools to create predictive models, separate engineering teams were also building bespoke one-off systems to use these models in production. As a result, the impact of ML at Uber was limited to what a few data scientists and engineers could build in a short time frame with mostly open-source tools.
Features in Action
For a great example of how a series of raw data elements can be mathematically transformed into features, check out the interactive “Duke University FICO Model”. My students will have an exercise to triage this interactive model to identify the 4 to 5 most important features in determining an applicant’s likelihood of repaying their loan (Figure 3).
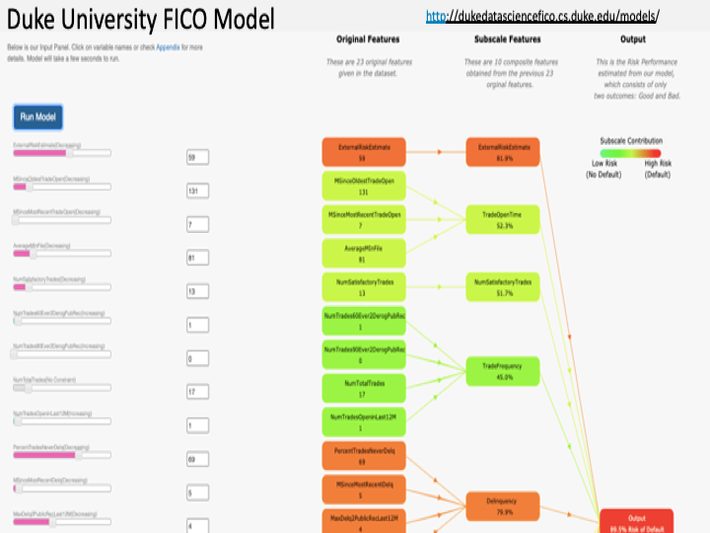
Figure 3: Duke University FICO Model
Since the same Features could be used to train multiple ML models, investing in engineering high-quality, high-fidelity Features that can be shared, reused, and refined across multiple use cases is critically important in driving an organization’s data monetization efforts. Makes Features a great candidate for Schmarzo’s Marginal Propensity to Reuse!
Features and the Marginal Propensity to Reuse
In the blog “Mastering the Data Economic Multiplier Effect and Marginal Propensi…”, I introduce the concept of the Marginal Propensity to Reuse (MPR).
Marginal Propensity to Reuse (MPR) states that an increase in the reuse of a data set across multiple use cases drives an increase in the attributable value of that data set at marginal cost.
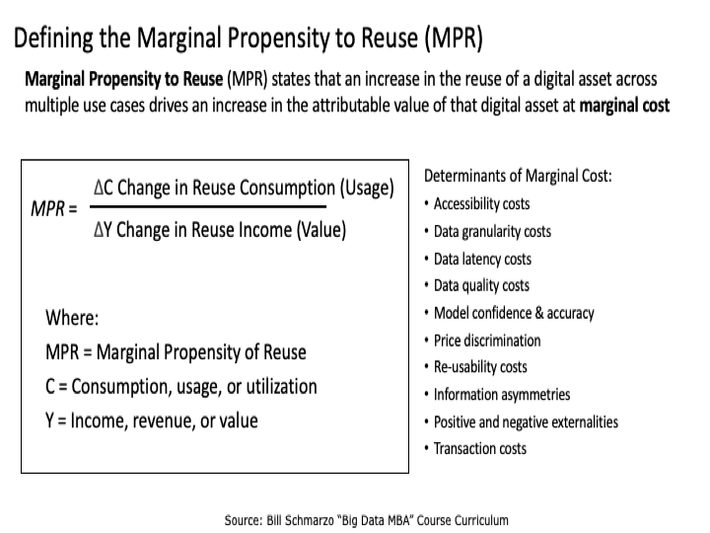
Figure 4: The Marginal Propensity to Reuse (MPR)
Features exhibit the same Marginal Propensity to Reuse characteristics as data. Often the same features are used to train multiple ML models to support multiple business and operational use cases. This is similar to the Data Economic Multiplier Effect concept, except for Features! The result is that the predictive and operational improvements (accuracy, completeness, granularity, latency) driven by the continuous refinement of Features ripples through all the other ML models and use cases that reuse those same Features.
Understanding ML Features Summary
More than just data, it is features that enable ML models to make the predictions that support the business and operational use cases that drive quantifiable financial impact.
Features are the natural steppingstone between raw data and the predictive ML models that support the optimization of the organization’s business and operational use cases (Figure 5).

Figure 5: Data-to-Feature-to-ML Models-to-Use Case Relationship
Note: I’m hoping to get lots of feedback on Figure 5 because I know that there are folks out there with a lot more practical experience engineering and managing Features than me.
Some key points about Figure 5:
- Value is defined by the business and operational use cases (decisions) and the supporting KPIs against which use case progress and success is measured.
- Features are a higher-level data construct that ML models use to make predictions; that is, features are created through the mathematical transformations and combinations of raw data.
- Not all data is of equal value. Some data elements are more valuable in their ability to be transformed and combined into Features.
- Not all Features are of equal value. Some are more important in driving ML model predictive accuracy and precision.
- Features are economic assets that can be shared, reused, and continuously refined across an unlimited number of ML model to support an unlimited number of business and operational use cases (Feature Stores).
In summary, while data is considered the most valuable resource in the world, it is actually Features and their ability to accelerate and scale the ML models to make predictions that support the business and operational use cases that are driving quantifiable financial value.
By the way, if you want to learn more about Features, check out these sources:
- What are Feature Stores and Why Are They Critical for Scaling Data Science?
https://towardsdatascience.com/what-are-feature-stores-and-why-are-… - Amazon SageMaker Feature Store: https://aws.amazon.com/sagemaker/feature-store/#
- Tecton: What is a Feature Store: https://www.tecton.ai/blog/what-is-a-feature-store/
- DataRobot: What is a Feature Variable in Machine Learning? https://www.datarobot.com/wiki/feature/