
As an Applied Data Scientist at Civis, I implemented the latest data science research to solve real-world problems. We recently worked with a global tool manufacturing company to reduce churn among their most loyal customers. A newly proposed tool, called SHAP (SHapley Additive exPlanation) values, allowed us to build a complex time-series XGBoost model capable of making highly accurate predictions for which customers were at risk, while still allowing for an individual-level interpretation of the factors that made each of these customers more or less likely to churn.
To understand why this is important, we need to take a closer look at the concepts of model accuracy and interpretability. Until recently, we always had to choose between an accurate model that was hard to interpret, or a simple model that was easy to explain but sacrificed some accuracy. Classic methods like logistic regression or a simple decision tree make it easy to explain why we assign a person to the positive or negative class, but there is only so much predictive power we can squeeze out of these basic models. To improve accuracy, more complex models may use thousands of these decision trees and then combine their results with yet another model or ensemble rule (e.g. majority vote). On the other end of the complexity spectrum, deep learning uses neural networks with multiple interconnected layers, each layer looking at a higher level of abstraction of the underlying data. This added complexity gives these models more flexibility, allowing them to reach high accuracy levels that cannot be obtained by simple models, but at the expense of our ability to comprehend why the model made the predictions it did. Even the people who designed and trained the model can no longer explain what led one person to get assigned to one class over another. For the work we do at Civis (where our models have to generate insights and recommendations for actions), getting the trade-off between accuracy and interpretability just right can be a difficult balancing act. With SHAP values, we are finally able to get both!
The SHAP values technique was proposed in recent papers by Scott M. Lundberg from the University of Washington [1, 2]. It is based on Shapley values, a technique used in game theory to determine how much each player in a collaborative game has contributed to its success. In our case, each SHAP value measures how much each feature in our model contributes, either positively or negatively, to a customer’s predicted churn risk score (see Figure 1). This is a similar idea to feature importance in logistic regression, where we can determine the impact of each feature by looking at the magnitude of its coefficient. However, SHAP values offer two important benefits. First, SHAP values can be calculated for any tree-based model, so instead of being restricted to simple, linear — and therefore less accurate — logistic regression models, we can build complex, non-linear and more accurate models. Second, each individual customer will have their own set of SHAP values. Traditional feature importance algorithms will tell us which features are most important across the entire population, but this one-size-fits-all approach doesn’t always apply to each individual customer. A factor that is an important driver for one customer may be a non-factor for another. By looking only at the global trends, these individual variations can get lost, with only the most common denominators remaining. With individual-level SHAP values, we can pinpoint which factors are most impactful for each customer, allowing us to customize our next actions accordingly.
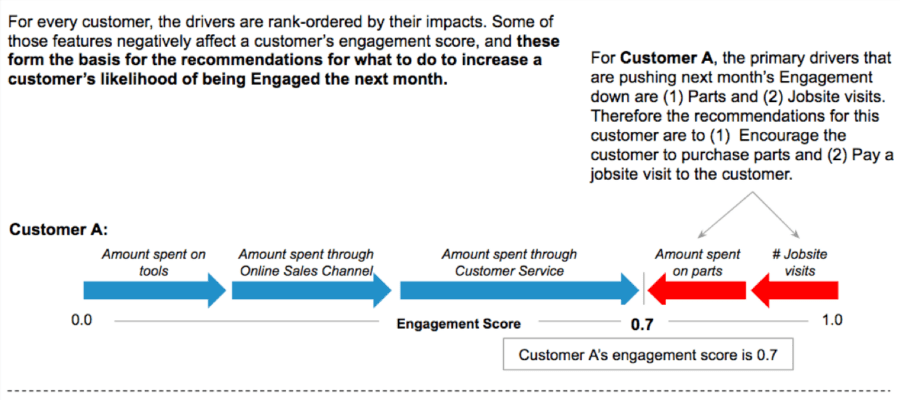
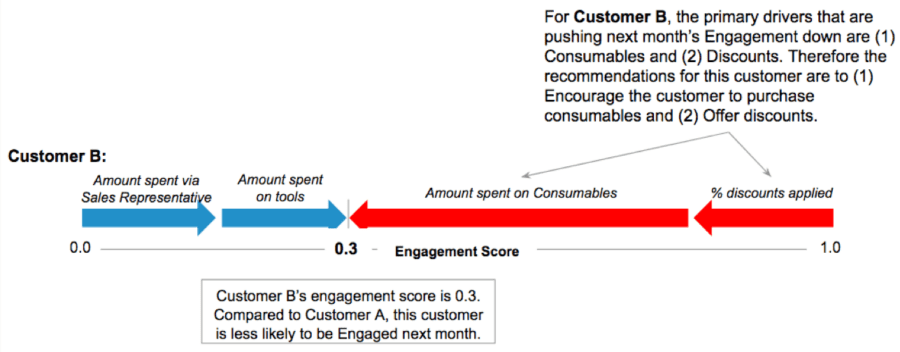
Figure 1. SHAP values measure the impact of each variable on a customer’s Engagement score (measuring their likelihood to remain a loyal customer in the next month or year). For each individual customer, this allows us to identify the biggest risk factors (red arrows) and protective factors (blue arrows), and recommend a tailored intervention plan.
While SHAP values can be a great tool, they do have shortcomings (although they are common in calculating feature importance using observational data). For one, SHAP values are sensitive to high correlations among different features. When features are correlated, their impact on the model score can be split among them in an infinite number of ways. This means that the SHAP values will be lower than if all but one of the correlated feature(s) had been removed from the model. The risk is that dividing impacts this way makes them look less important than if their impacts remained undivided. To be fair, all known feature importance methods have this problem. A second shortcoming is that SHAP values represent a descriptive approximation of the predictive model. For example, SHAP values can tell us that for a given customer, a low number of sales visits has the largest negative impact on their risk score, so we may decide to schedule more sales visits in the upcoming month. However, we cannot determine based on the SHAP values alone what the impact of this intervention will be. Again, this is a fundamental limitation to data science. There is only so much we can do with observational data. To accurately estimate the impact of different churn prevention techniques, we will need to conduct a randomized controlled trial (RCT).
We think there’s a lot of promise in SHAP values. Instead of having to choose between accuracy and interpretability, we finally have a tool that lets us push the envelope in terms of model complexity and accuracy, while still allowing us to derive intuitive explanations for each individual prediction. SHAP values have been added to the XGBoost library in Python, so the tool is available to anyone. Scott Lundberg, the author of the SHAP values method, has expressed interest in expanding the method to a broader selection of models, beyond tree-based algorithms. As we continue to test this out further, we’ll report back with our experience!
References:
- Lundberg SM, Lee SI (2017), “Consistent feature attribution for tree ensembles”, presented at the 2017 ICML Workshop on Human Interpretability in Machine Learning (WHI 2017), Sydney, NSW, Australia (https://arxiv.org/abs/1706.06060)
- Lundberg SM, Lee SI (2017), “A Unified Approach to Interpreting Model Predictions”, Neural Information Processing Systems (NIPS) 2017 (https://arxiv.org/abs/1705.07874)
By Peter Cooman, Senior Applied Data Scientist