
by Peter Bruce, President & Founder, Statistics.com

Nearly everyone is now familiar with the IHME Covid-19 forecasts (also called the “Murray” model after the lead project investigator at the Institute for Health Metrics and Evaluation), and perhaps its associated interactive visualizations.
Many of us check our state, the country, and some a few other countries as well, to see when peak deaths are forecast; this April 10 IHME plot of the U.S. as a whole (Figure 1) predicts a peak of about 2400 deaths/day in mid April (the pink shaded area is an uncertainty interval around the forecast line):
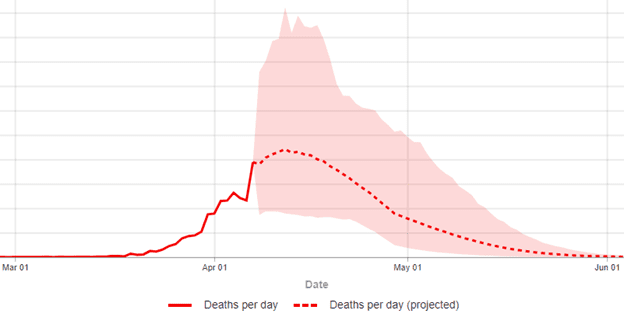 Figure 1: IHME 4/10/20 Predicted Deaths per day (Y-axis peaks at 5.5K, with intervals of 500)
As of April 13, 2020, the IHME model was forecasting approximately 61,000 U.S. deaths from the virus through August 4, 2020. This was a drop from 81,000 a couple of weeks ago, which was itself a drop from 93,000. Earlier, the news media was focused on the Imperial College (UK) model that forecast up to 2.2 million deaths. How can models of the same thing differ so dramatically?
Different models — and different runs of the same model — may differ both in their structure and their assumptions.
SIR Models
Infectious diseases are the province of epidemiologists, and their workhorse model, the SIR model, simulates individuals in the community moving through three phases (or “compartments” in SIR models):
- Susceptible (not infected, but not immune)
- Infectious (infected and contagious)
- Recovered (no longer infected, and now immune to infection)
These models are governed by several assumptions, the key ones being:
- The size of the susceptible community
- The period during which the disease is infectious
- The disease reproduction rate, R0, or how many new people are infected by each case when the virus is in its early, unimpeded phase
For each successive day that the model is predicting, the basic SIR model uses equations that take the assumptions and determine what percentage of S (the Susceptibles) are infected and move to I (the Infectious), what percentage of I die and what percentage of I recover and move to R. Those in R (not to be confused with the reproduction rate R0) are assumed to have immunity to the virus. SIR models often have additional parameters that govern how the infection rate, recovery rate, and death rate change at particular times.
The 2.2 million deaths prediction by the Imperial College model was from a run that assumed no social distancing of any sort was implemented — that the virus was allowed to run wild. Other runs of the model examined other scenarios with increasingly strict social distancing measures; they simply didn’t make the news. The Imperial College model assumed that each infected individual would in turn infect, on average, 2.5 other people. More recent estimates from Europe suggest this assumption should be higher, which would increase the impact of social distancing.
One defect of SIR models is that they can be extremely sensitive to small changes in their assumptions. Since the number of infections each time period is multiplied by R0 to predict the next time period, things can increase very rapidly (“exponentially”) and this means that small differences in initial assumptions, over time, result in large changes in outcome. For instance, a 10% increase in R0, say from 2.3 to 2.5, leads to an 80% increase in the predicted number of people infected during the epidemic.
Another issue with standard SIR models is that they work with rates like R0, not directly with variables that measure behavior changes such as social distancing, vaccinations, medical treatments, or seasonal effects. These factors are only indirectly represented by changing R0 (and the other rate parameters) over time.
Statistical Models
The IHME team developed their model not by simulating virus growth based on epidemiological assumptions and equations, but by fitting a curve to prior data. And they focused on death rates, not virus incidence, as the latter is sensitive to differences in testing rates. Initially, they relied mainly on the data from Wuhan, China as the base curve.[1] The modeling process compares the actual to-date curve for a given geographic entity, such as the state of Virginia, to the base curve. A key variable is “number of days after the death rate exceeded 0.31 per million to the day when 4 different social distancing measures were mandated by local and national government: school closures, non-essential business closures including bars and restaurants, stay-at-home recommendations, and travel restrictions.” The phasing in of restrictions was accounted for by counting days with different restrictive measures differently: “days with 1 measure were counted as 0.67 equivalents, days with 2 measures as 0.334 equivalents, and those with 3 or 4 measures as 0.”
On April 6, the IHME team revisited its model to refit it, including new data from Italy, Spain and other countries that were well along the growth curve. The adjusted model was deployed and yielded growth curves that peaked earlier than the initial model, with cumulative death totals that were smaller. The IHME tool has gained popularity for its accuracy but also due to its powerful dashboard tools.
Conclusion
SIR models can take changing conditions into account by tweaking key parameters and assumptions at the discretion of the analyst, whereas statistical curve-fitting models do so by re-fitting the curves as new data become available. SIR models provide the tools to explore what could happen, given different future conditions, and are most useful before much data is available. Statistical models are necessarily grounded in data — on what has happened – and usually prove more accurate as events unfold.
[1] In a forthcoming blog a colleague will demonstrate that data on COVID-19 originating from Communist China has shown very little fidelity to reality, and will argue for its complete removal from any analysis to improve models.