
by Peter Bruce, President & Founder, Statistics.com

Although there are frequent reports in the news media of young people contracting serious cases of COVID-19 and even dying, the disease in its serious form is overwhelmingly a disease of older people. Data on US deaths from the U. S. Centers for Disease Control in Figure 1 portray this vividly. (We focus on deaths rather than cases of Covid because deaths are less affected by differences in testing.)
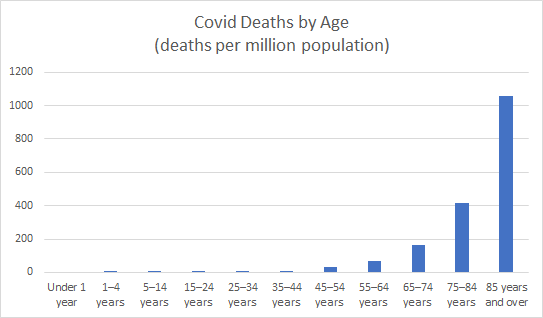
Figure 1: US Covid Deaths (per million population) by Age
It is also well known that those in poor health are more likely to die from Covid. Data from New York City as of April 15 show that 5151 (75%) out of the 6839 Covid deaths had additional underlying medical conditions (diabetes, lung disease, cancer, immunodeficiency, heart disease, hypertension, asthma, kidney disease, and GI/liver disease). By contrast, 65% of the US population as a whole reported “very good” or “excellent” health, according to CDC data.
Moreover, the worse your health (number of underlying conditions prior to Covid infection), the more likely you are to die. In a study of 528 patients who died in Italy early in the outbreak, virtually all of them had at least one co-morbidity (underlying non-Covid disease). Nearly half of the deaths had 3+ co-morbidities, as shown in Figure 2.
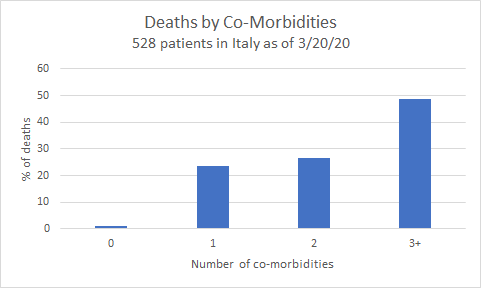
Figure 2: Italy Covid deaths (%) by number of co-morbidities
Is There Really an Age Effect?
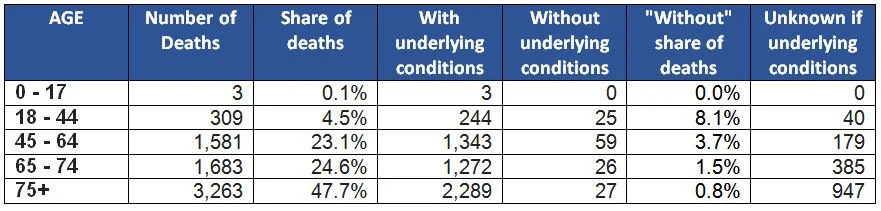
Old age and declining health go hand in hand. Could it be that the greater risk faced by those of advancing age is really just a reflection of their compromised health? Further examination of the New York City data suggests, at first glance, that this might be the case. Table 1 disaggregates NYC deaths (through April 14) by age and health.
Table 1: NYC deaths by age and underlying health condition
 Several points are worth noting:
- At first glance, looking just at the “Share of deaths” column, the effect of age seems overwhelming – nearly half the deaths are in the 75+ category (only about 8% of the general population is this old).
- Looking closer at the “Without underlying conditions” column, though, we see that healthy older people do not account for many deaths.
- Nearly all the deaths had some form of co-morbidity; people known to be healthy accounted for only 2% of the deaths (as with the study in Italy).
When we look at death rates (not share of deaths), though, and separate out the “with underlying conditions” population from the “without underlying conditions” population, we see there is an age effect in each. Table 2 (with underlying health conditions) and Table 3 (without underlying health conditions) each show ascending death rates as you get older. (See Note 1 for sources on population data.)
Table 2: Death rate, by age, among those without underlying health conditions
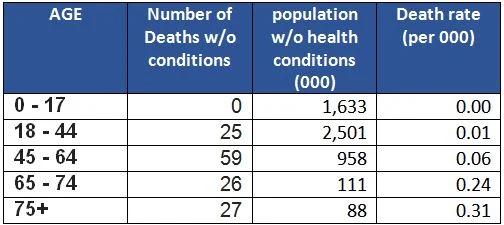
Table 3: Death rate, by age, among those with underlying health conditions
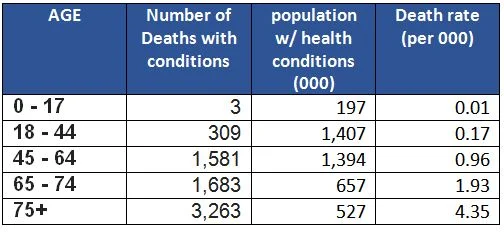
For example, among both the healthy and unhealthy populations, death from Covid is roughly five times more likely among 75+ year-olds than among 18-44 year-olds. However, the health effect is far stronger than the age effect: having underlying health conditions boosts the risk fifteen-fold for both those age groups.
Caveats
- This is a limited dataset for New York City at one period in time.
- The “Unknown” column tempers the definitiveness of the conclusion about health and age a little, though not much if we assume the unknowns are distributed like the knowns.
- These data reflect deaths, not Covid infections – many younger healthy people carry the virus without symptoms.
Conclusion
These data from New York City show that both aging and being unhealthy, separately, contribute to a greater risk of dying from Covid. The risk from being unhealthy, though, is far greater.
Note 1. Data for NYC population by age group is from Baruch College, their source was US Census American Community Survey). Estimates for the population with health conditions are from the Centers for Disease Control for over 55 groups, and the Rand Corporation report Multiple Chronic Conditions in the United States. Interpolation and averaging of sources were used where age groups did not match up exactly to the age groups in the NYC health data. Data on population groups without underlying health conditions is, naturally, the balance remaining after those with conditions are subtracted from the overall.