- Data analysis is fraught with pitfalls, including too-small sample sizes.
- Bias can creep into the most well-intentioned of studies,
- Tips to avoid bias and choose the best statistical test.
So you’ve formed your breakthrough hypothesis, created a bulletproof test procedure and waited eagerly for the results to come in. To your surprise, the magnificent effect you were sure of just isn’t there. What went wrong? Was it the way your hypothesis was worded? An error in the statistical calculations or the way the data was collected? While many errors can easily creep into studies, one of the most likely suspects is simply that your study had too few participants to show an effect. Other common pitfalls include misuse of appropriate statistical tests, or using the wrong one in the first place. And let’s not forget bias: If you are sure that you don’t have any bias in your results, then you’re probably wrong (and might want to check again!).
Sample Sizes too small
Tom Brady, writing for SealedEnvelope.com writes that “Many studies are too small to detect even large effects” [1].
To ensure your carefully planned (and likely very expensive) study stands a good chance of showing effects, you have to pick the correct sample size. Too large of a sample size and you’ll run out of cash, fast. Too small of a sample and you’re doomed to failure before you can run that glorious chi-square test [no term]. So the question becomes…what is the “ideal” sample size? Unfortunately, there isn’t a clear answer; Finding the right number is more of an art than a science. A few general tips to get you started [2]:
- Conduct a census [no term]. That is, if at all possible, ask everyone in your population. Works well if you have 1,000 potential data points or less.
- Use a sample size from a similar study. It’s hard to reinvent the wheel, but you may not have to. The chances are, someone, somewhere has performed a similar study. Search the literature (Google Scholar might be a good place to start) to see if you can locate another study. If your study is fairly generic, you might also be able to identify an optimum sample from a published table, or an online sample size calculator.
- Use a Formula like Cochran’s Sample Size Formula [no term]. These aren’t always easy, because you’ll usually have to know a little about what your expecting to find. For example, Cochran’s requires you to make a guess about the portion of the population that has the attribute you’re interested in.
Bias
Bias [no term] is where your results overestimate or underestimate the population parameter of interest. It’s practically impossible to completely avoid every bias; There are dozens of ways it can creep in to every phase of research, from planning to publication [3]. However, you can take steps to avoid it by carefully designing and implementing your study. Some general tips in avoiding bias:
- Always use a random selection method for your sample (e.g. SRS),[no term]
- Use blinding if applicable,
- Control for confounding variables [no term]. Confounding variables are unwanted extras in your analysis. For example, if you’re studying the effect of activity level on weight gain, then age is a confounding variable (e.g. teens are less likely to put on weight than someone of middle age).
- Study the different types of bias to help you identify problem areas.
Ensure that any sources you’re using are objective. For example, don’t refer to a lung cancer study that has been paid for by a tobacco manufacturer.
Use the Appropriate Test

The “go to” tests (e.g. chi-square, t-test) [no term] are well understood and widely implemented. don’t be tempted to run a more obscure test unless you can justify your choice and provide objective references from the literature. There are situations where you might want to run unusual tests. For example, Vincent Granville writes [4] “I used these tests mostly in the context of experimental mathematics, [where] the theoretical answer to a statistical test is sometimes known, making it a great benchmarking tool to assess the power of these tests, and determine the minimum sample size to make them valid.” As an example, instead of the chi-square test for normality, you could split your data into two equal sets {X, Y}, then test if (X + Y) / SQRT(2) has the same distribution as Z. According to Granville, this works as long as you don’t have an infinite theoretical variance.
Some general tips on what to do when choosing a test:
- Consider the type of variables you have. For example, make sure to account for ordered variables and be careful that your “independent samples” aren’t paired or dependent.
- Don’t dichotomize continuous variables in your analysis,
- Don’t use parametric methods unless you’ve verified your residuals or outcome is normally distributed,
- Use two-tailed tests instead of one-tailed if at all possible,
- Avoid p-values unless you’re intimately familiar with their pitfalls. For example, a small p-value isn’t always “better” than a bigger one [5]. Use confidence intervals instead.
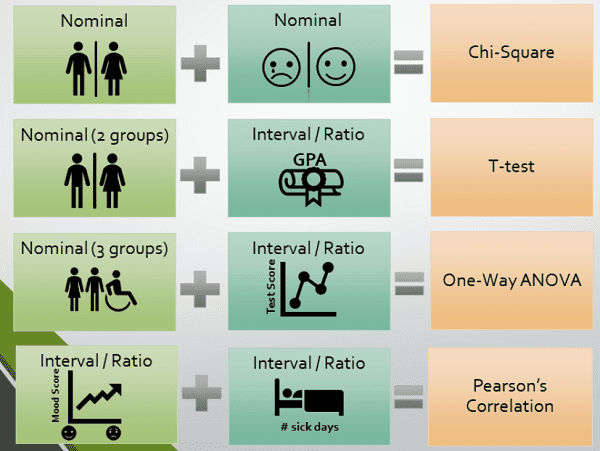
If you have the statistical knowledge to assess find and analyze those theoretical answers, obscure tests can be a break from the monotony. But if statistics isn’t your forte, then you should probably stick to the usual suspects. Not sure where to start? See my previous post on choosing the right statistical test.
References
[1] Reviewer’s quick guide to common statistical errors in scientific p…
[3] Identifying and Avoiding Bias in Research
[4] A Plethora of Original, Not Well-Known Statistical Tests
[5] Common pitfalls in statistical analysis: “P” values, statistical si…
