

Ready for some sobering stats? The average mobile app loses 77% of its DAUs within the first 3 days after install. Within 30 days, that number jumps to 90%. Within 90 days, it’s over 95%.
For your app to succeed, you can’t let these stats be your reality. It’s easy to look at your app’s growth metrics and see what you want to see. A million downloads? Woohoo! But downloads and installs don’t fuel your business. Only 23% of users come back to an app just three days after downloading. Those downloads may boost your acquisition numbers, but you wouldn’t call that a win.
You can’t afford to lose hard-won users you’ve invested time, energy, and money in converting. Reducing your churn rate needs to be your #1 priority. And you can’t reduce it without measuring it. In this article, I’ll explain how to do exactly that. By the end of this post, you’ll know how to calculate churn and understand key benchmarks. And you’ll have some practical strategies to reduce attrition for your mobile app.
Here’s what we’ll cover:
- Defining Churn Rate
- Why Churn Matters
- What Causes Churn
- Churn Rate Benchmarks
- How to Calculate Churn Rate
- Using Cohort Analysis to Reduce Churn
- Other Tactics to Decrease App Churn
Defining Churn Rate
First things first:
What is churn rate?
Churn rate, also known as the rate of attrition, is the percentage of users who stop using an app within a given period.
For an app to grow, the number of new users must be a higher than the number of users who leave.
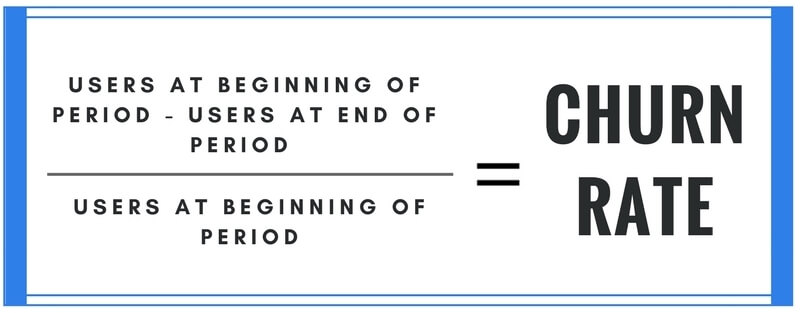
Say you start January with 600 users, and at the end of the month, you have 400 users.
Here’s how you would calculate your churn rate:
(600-400)/600 = 33.33% churn rate.
Why Churn Matters
Why should you care about churn? Because it suppresses growth. Think of it like a leaky bucket. As users drip out, you’re struggling to “refill” your bucket with new users. And that gets expensive fast.
- Acquiring a new customer is 5-25x more expensive than retaining one
- Reducing churn by just 5%can boost profitability by 75%
- Improving retention has a 2-4x greater impact on growth than acquisition
- The probability of selling to an existing customer is 60-70%, but only 5-20% for a prospect
But that’s not all…Churn rate also informs metrics like customer lifetime value and retention rate (the inverse of churn rate.) Together, these numbers can help you build more accurate forecasts for growth, revenue, and scaling efforts. They show how your app is performing now and what to expect for the future.
What Causes Churn
Churn isn’t simple and straightforward. A wide variety of factors come into play — and it differs for each set of users. But common sources of churn include things like:
- Cost
- Poor onboarding experience
- Poor user interface or user experience
- Lack of features
- Competitor products
- Poor product/market fit
- Lost value perception of the app
The good news? You CAN address the causes by gathering user feedback to uncover where the friction points lie within your app.
Churn Rate Benchmarks
All apps will experience some churn, even the most successful ones. So you may be asking yourself: What’s an average churn rate? What’s normal?
Let’s start with some quick facts and benchmarks for mobile apps:
- Across iOS and Android, worldwide retention after 90 days is just 4%.
- 90% of people who install an app will abandon it within a month.
- Just 24% of users accessed an app one day after first use
- The average Android app loses 80% of daily active users within 3 days after install
Across the board, the average churn rate for app users is around 80% within 90 days.
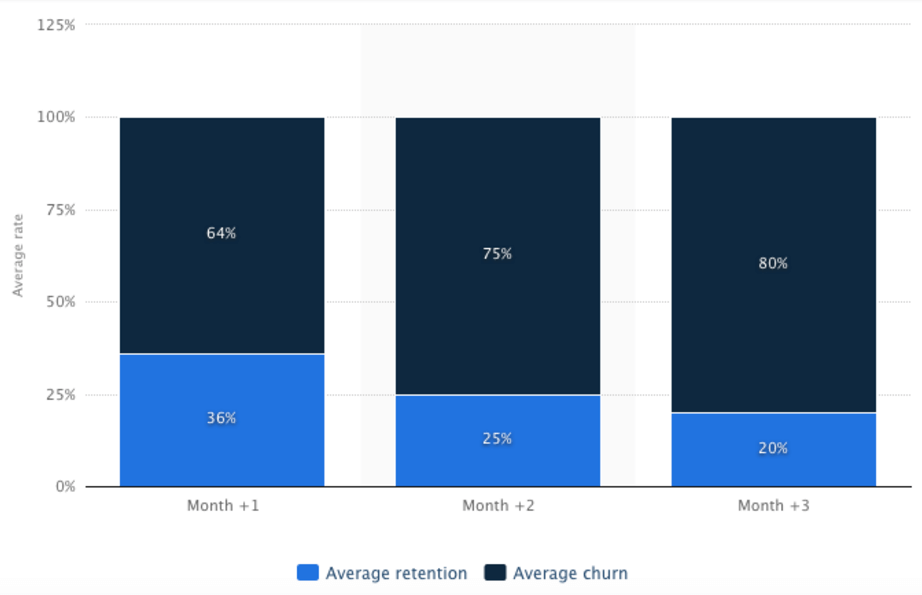
As you can see, there’s a lot of room for improvement. Retention is hard to master and can be an uphill battle. But even small gains can have a significant impact on your success.
Now let’s zoom in a bit and look at average rates based on category.
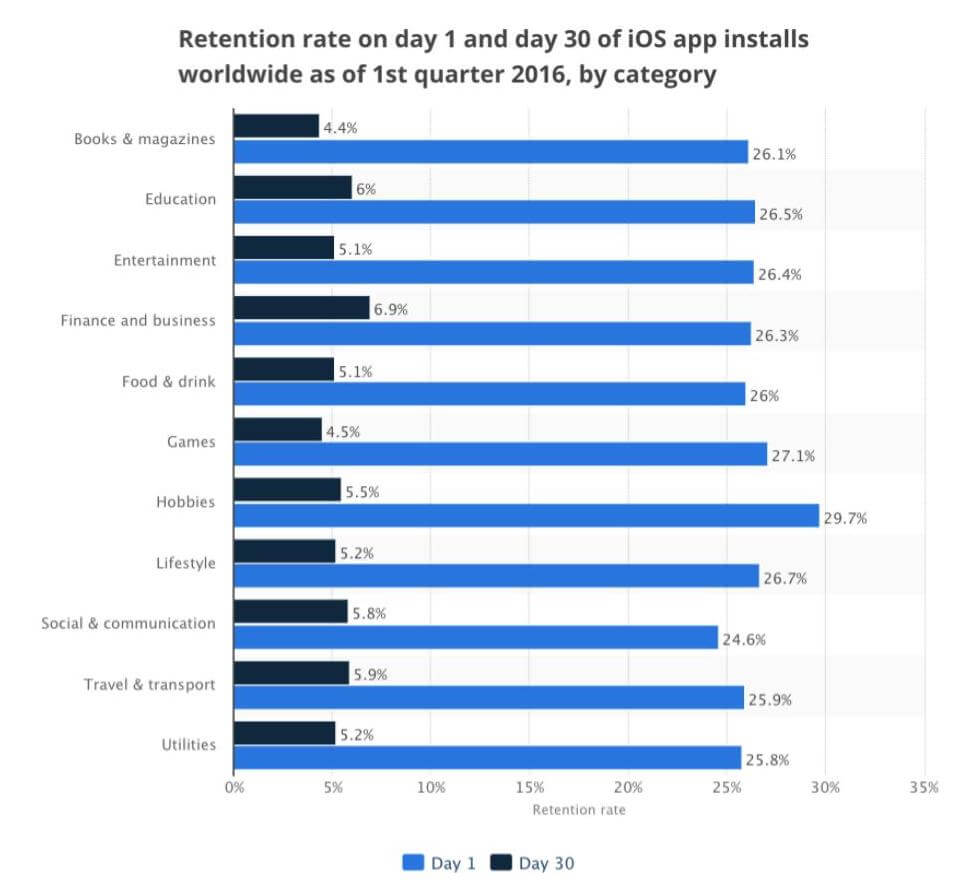
Churn rate varies by app type, but it’s clear that no single industry has cracked the code when it comes to retaining new users. Rates are high across the board. Mobile apps must get better at providing value early and often. With these benchmarks in mind, it’s time to take a hard look at your app. Step one is to calculate your baseline churn rate, so you know where you stand.
How to Calculate Churn Rate
You can calculate churn a few different ways, depending on what you need to know. In some cases, you may want to find your monthly rates to get a closer look at monthly growth and retention. Other times, you may want to calculate your annual rates to see how growth is evolving year over year.
Let’s look at a couple of monthly and annual calculations in action.
Monthly Churn Rate
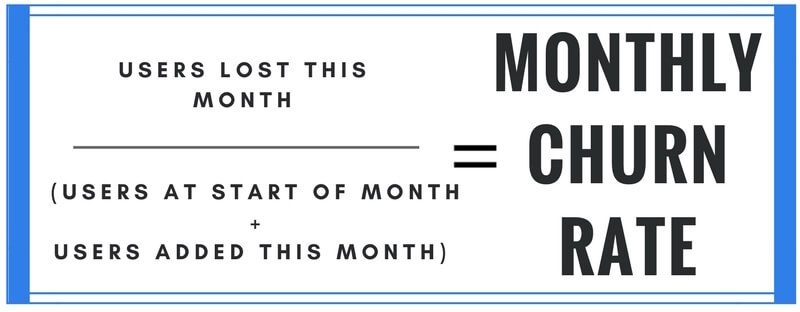
Here’s an example equation:
Users at start of month: 2,000
New users added that month: 400
Users lost at the end of month: 366
Monthly churn rate: 366/2,400 = 15.2%
Annual Churn Rate
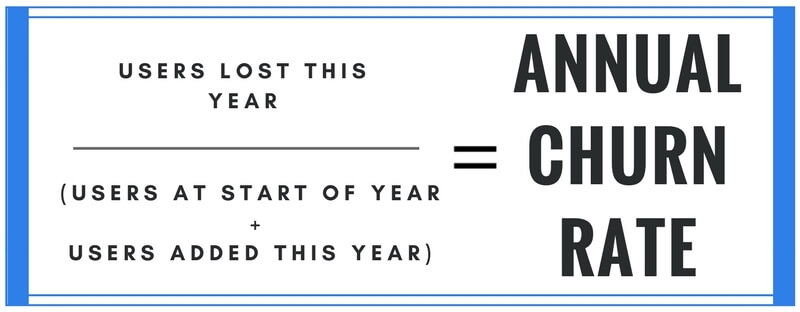
Here’s an example equation:
Users at start of year: 50,501
New users added during year: 16,765
Users lost at the end of year: 27,890
Annual churn rate: 27,890/67,266 = 41.5%
These two calculations are a good starting point for some entry-level figures.
Keep in mind, though, that rapid growth can make these simple equations less accurate. This is especially important for new apps to remember. In this case, consider using a different formula like probability calculations.
Here’s an example of when it makes sense to use the probability calculation: If your app is adding new users at a fast enough pace, both churn and the number of new users can go up. If the number of new users is increasing more than your churn rate, the rate will decrease. The problem? The way the calculation is set up means all those new users can skew the numbers and make it seem like you have a lower churn rate than you do. It might look like you’re improving when in reality it’s getting worse.
Probability Churn Rate
Stephen Noble of Shopify came up with this solution for calculating churn as a probability.
Here’s how it works:
Each day a user keeps an app is a time when they didn’t churn. So, over the course of ten days, there were ten opportunities for that user to leave forever. A user day is defined as one day that a user remained active.
To calculate your probable monthly churn, start with the number of users who churn that month. Then divide by the total number of user days that month to get the number of churns per user day. Then multiply by the number of days in the month to get your resulting monthly churn rate.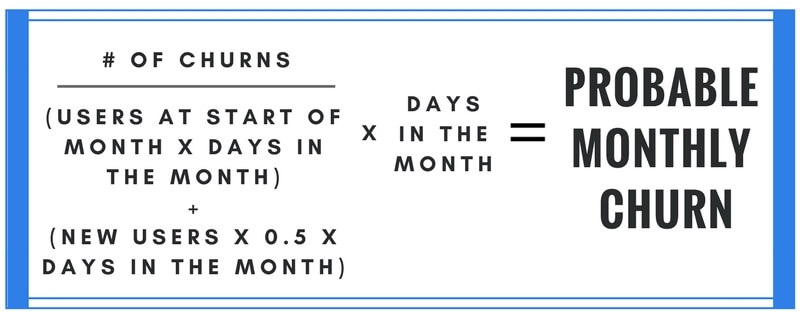
Here’s an example equation:
Users at the start of the month: 1,000
Users at the end of the month: 1,322
Net new user gain: 322
Days in month: 30
User days in month: (1,000 x 30) + (0.5 x 322 x 30) = 34,830
Total churns in month: 366
Churns per day: 366/34,830 = 0.01%
Monthly churn rate: 30 x 0.01% = 0.3%
Notice how this method factors in probabilities? This approach helps account for rapid growth that can skew monthly and annual formulas.
Using Cohort Analysis to Reduce Churn
Once you’ve established your baseline rates, you can use cohort analysis to find out where to focus your retention efforts. Instead of looking at all your users as a whole, cohort analysis breaks them down into related groups. By comparing and trending cohorts, you can uncover the specific reasons users leave and which actions drive retention. You might look at:
- Acquisition Channel (Where are your most successful users coming from? Search, social, paid ads, referral, etc.)
- Action (What actions do your most successful users take? Create an account, create a playlist, add 5 friends, etc.)
- Time (How long does it take your most successful users to complete those actions? An hour, a day, a week?)
Cohort data helps you discover trends and patterns, so you can pinpoint what hooks new users and keeps them coming back.
You can study this visually using a cohort graph like this:
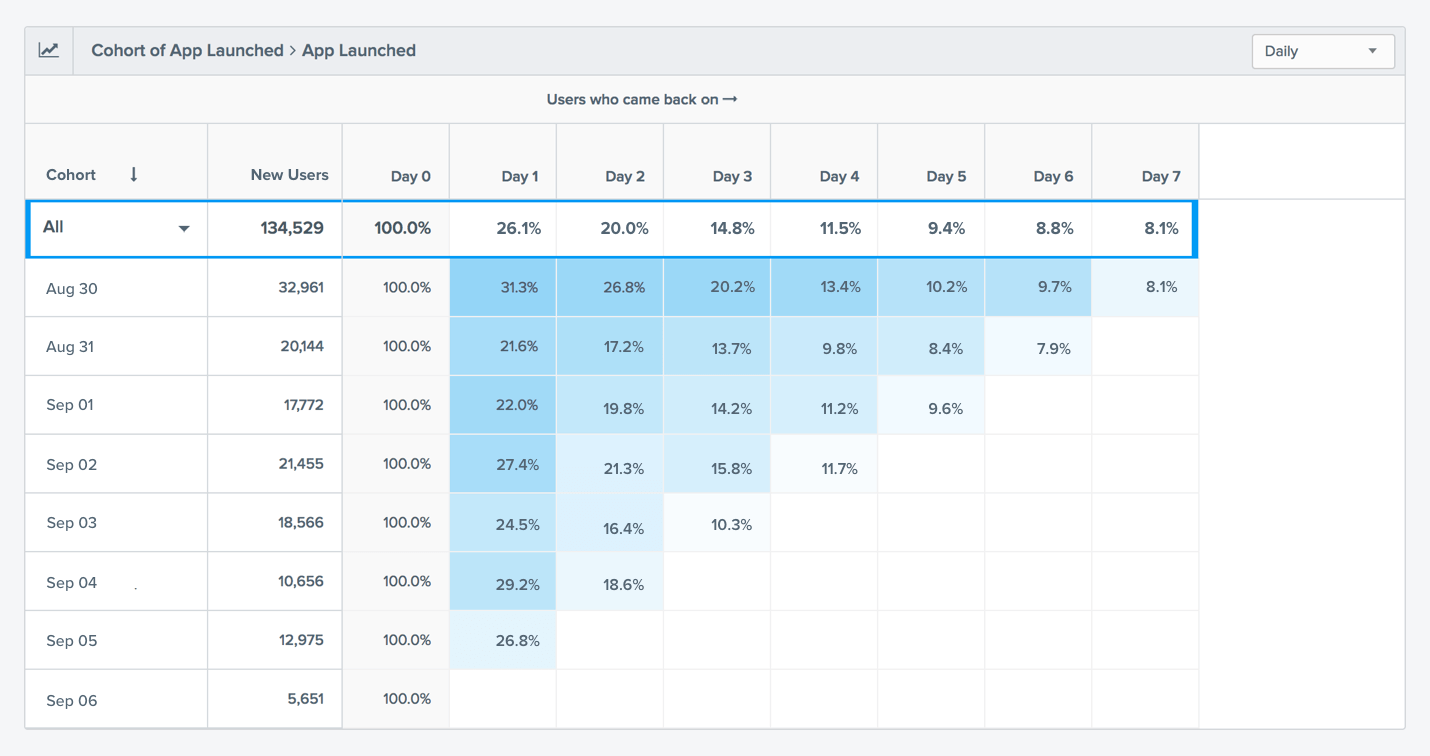
The y-axis shows a series of groups representing new users who first downloaded the app on that specific day. The x-axis indicates the number of users who launched the app that same day, one day after, two days after, etc. With this graph, you can see where the most significant drops in user retention occur.
So how does cohort analysis help identify causes of churn?
It shows you the most important moments in your user journey. Say you have a food delivery app. For the past few months, new users have been engaged, typically submitting an order within the first three days of installing the app. But in week two, they’re spending less time in the app and placing fewer orders. By the end of the first month, they’ve stopped opening your app altogether.
What’s the problem?
By breaking your user base down into cohorts, you see that most of your retained users who are placing regular orders launch the app between 10 and 11 am. Users who don’t open the app until after noon either close the app within 90 seconds or abandon their cart. 98% of these users become inactive or leave within the first month.
So what can you do to boost engagement?
Send a personalized push notification to these users between 10 and 11 am reminding them to order lunch, along with a promo code. You can only spot those patterns by breaking your user base down into smaller groups.
Other Tactics to Decrease App Churn
Now that you know a few ways to calculate churn let’s look at some more ways to decrease it.
Here are a few strategies to get you started:
- Optimize onboarding.
If your onboarding process doesn’t immediately showcase your app’s core value, users will churn. Keep the onboarding process focused on benefits. Strip down complexity, limit the number of steps, and get users to experience your app’s aha moment as fast as possible.
- Leverage push notifications.
Send automated push notifications to a user’s home screen to encourage repeat visits, engagement, and purchases. With a personalized approach, these notifications can reactivate users who are at risk of churning.
- Personalize.
With personalized interactions and relevant messaging, users feel like you’re actually speaking to them. You can’t take a one-size-fits all approach. Leverage user data like first name, behaviors, and preferences to customize interactions.
- Consider deep linking.
Mobile apps operate on URLs instead of URLs. That means deep links (or direct links) can take users right to a particular screen inside your app. These links can launch an app from exactly where a user left off, or take them to a specific product page. This can be a smart approach to reactivate monthly active users.
- Take advantage of in-app messages.
In-app messaging shows users the right message at exactly the right time. You can welcome new users launching your app for the first time and help them discover new features. Or you can display a personalized promo when they view a particular product.
A Smarter Way to Reduce Churn
Can you fix a high churn rate? Absolutely. But only with a strategy based on the right data. By using data to understand why users leave, you can optimize your app’s user experience and get more users to count your app in their list of favorites. Lower your app’s churn rate with 6 psychology-backed strategies for creating apps users can’t live without.