
Summary: Finally there are tools that let us transcend ‘correlation is not causation’ and identify true causal factors and their relative strengths in our models. This is what prescriptive analytics was meant to be.

Just when I thought we’d figured it all out, something comes along to make me realize I was wrong. And that something in AI/ML is as simple as realizing that everything we’ve done so far is just curve-fitting. Whether it’s a scoring model or a CNN to recognize cats, it’s all about association; reducing the error between the distribution of two data sets.
What we should have had our eye on is CAUSATION. How many times have you repeated ‘correlation is not causation’. Well it seems we didn’t stop to ask how AI/ML can actually determine causality. And now it turns out it can.
But to achieve an understanding of causality requires us to cast loose of many of the common tools and techniques we’ve been trained to apply and to understand the data from a wholly new perspective. Fortunately the constant advance of research and ever increasing compute capability now makes it possible for us to use new relatively friendly tools to measure causality.
However, make no mistake, you’ll need to master the concepts of causal data analysis or you will most likely misunderstand what these tools can do.
Why Causality
In the age when the call for transparency in our models is a constant social media and regulatory cry, causality offers the greatest promise. Causal data analysis also gives you tools well beyond what you currently have to guide you to exactly what to do to get the best outcomes. This speaks to the heart of prescriptive analytics.
It may seem that correlation and curve fitting have done just fine at answering important questions like next best offer, is it fraud, what’s the value going to be, and even is it a cat. But there are a whole variety of questions that our users would like to have answered like:
- Given that there are X factors that predict preference for a product, which ones should the business actually try to influence, and in what order of importance. (What actually causes change in the target variable)?
Just ranking the strength of different variables on their ability to predict the target is not the same as selecting those that are independently predictive and evaluating their relative contribution to the outcome.
- What are the rankings of those key drivers that actually cause change and how do they compare to my competitors so that I can make smart marketing allocations.
Isolating a variable like ‘manufacturer’ within the same probability model doesn’t allow for re-ranking variables, and doesn’t answer the causality question to begin with.
- Did that medicine actually cure the disease?
This problem would require having actually performed both options on the same person, an impossibility in the real world. Simply splitting the sample universe into two gives a probability but not a causally supportable answer.
- Would I still have contracted cancer if I had not smoked for the last two years?
Similarly, there is no way to express the probability associated with two years of not smoking without having an apriori understanding of the strength of the causal relationship not answered by our probability models.
Some other examples of causal questions:
- Can the data prove whether an employer is guilty of hiring discrimination?
- What fraction of past crimes could have been avoided by a given policy?
- What was the cause of death of a given individual, in a specific incident?
We readily understand that we can’t prove causation from observations alone. We can observe correlation but that does not prove or even imply causation. There is no way we can test the statement “symptoms do not cause diseases” with correlation tools. Our models simply support that symptoms occur in the presence of disease, and disease occurs in the presence of symptoms.
Researchers have been stuck with trying to apply ‘common sense’ directional logic outside of the mathematics, but with no way to rigorously test or prove the degree of causation.
At a simple level, particularly in problems involving human behavior we include variables which are not mutable (age, gender, home ownership) alongside variables which might under some circumstances be controllable because they represent perceptions (is it stylish, is it reliable, is it easy, were you satisfied).
Correlation suffices so far, but the questions answered by causality are ‘which levers should I actually pull to effect change’. And beyond that, ‘what would happen if I changed some of the underlying assumptions in the model’ – the ultimate scenario problem.
Techniques
The techniques of causal modeling, more formally known as Structural Equation Modeling (SEM) have actually been employed in the social sciences and in epidemiology for many years.
It’s not possible to read much in this area without encountering the work of Judea Pearl, professor and renowned researcher in causality at the UCLA Computer Science Department Cognitive Systems Lab. His work first earned him the Turing Award in 2011 for his invention of Bayesian networks. Since then he has been the singular force trying to insert causality into AI/ML.
The techniques and mathematics of SEM are beyond the scope of summarizing in this article, but leave it to say that the fundamental math established by Pearl and the rapid evolution of graph models have made accessible causality tools available.
There are several open source packages available including:
DAGitty is a browser-based environment for creating, editing, and analyzing causal models. The focus is on the use of causal diagrams for minimizing bias in empirical studies in epidemiology and other disciplines.
Microsoft’s DoWhy library for causal inference.
The Tetrad Project at Carnegie Mellon.
Inguo.app is a commercial spinoff from NEC and backed by Dr. Pearl himself that appears to offer the most commercially ready and easily understood platform for causal analysis. Offered SaaS, it offers variations meant to directly facilitate explanation to users about key factors and what if scenarios.
Their site claims to return results in seconds where the number of variables is 60 or less, longer for more complex problems or more accurate results. One can easily imagine the combinatorial explosion that occurs as the number of variables increase.
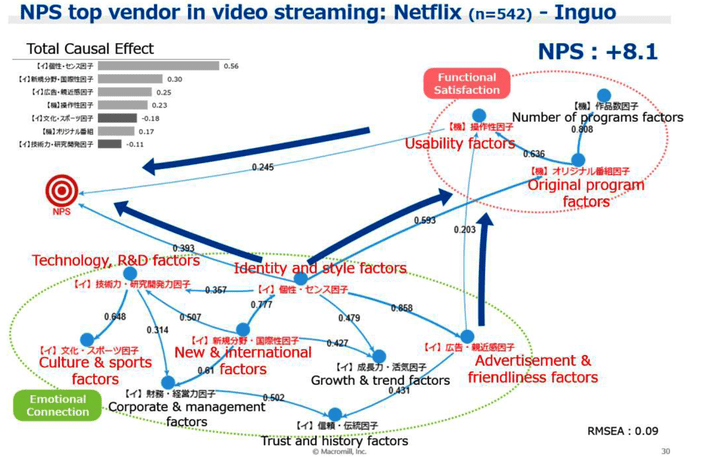
This diagram drawn from an Inguo case study shows the relative clarity with which causal factors and their relative strength can be determined. In this case the streaming video client was able to rapidly focus in on the two or three controllable variables that caused increased adoption as well as the relative strength of their contributions.
Why Understanding Causal Data Analysis is Critical
Although the graphics appear simple to interpret, helping your users to understand what is being predicted will require you to really understand the differences between causal data analysis and the AI/ML we’ve become used to. To give you just a few examples:
- Although we may determine that X is causal of Y it doesn’t mean that X is the only cause of Y. CDA recognizes that there may be many unexamined causes of Y so the real purpose of CDA is to determine the contribution of X to the outcome Y.
- Similarly, if we add up all the contribution values of X in our model they may not come to 100%, recognizing the statistical presence of unseen variables.
- Causality isn’t necessarily transitive. If we find that X causes Y and Y causes Z, we cannot conclude that X causes Z because we are dealing in ‘average causal effects’.
For a quick look at even more facts about CDA try this article.
For a deep dive into Judea Pearl’s most recent summary of the field find his current paper here.
The major takeaway here is that this is an expansion of our current toolset that finally allows us to answer user questions about what to do next based on true causal relationships. If you are struggling with transparency issues, examine causality tools. If you are simply ranking variables by the strength of correlation, you may be actively misleading users.
Other articles by Bill Vorhies
About the author: Bill is Contributing Editor for Data Science Central. Bill is also President & Chief Data Scientist at Data-Magnum and has practiced as a data scientist since 2001. He can be reached at: