
Role of Augmented Analytics in Future !! Insight generation is changing (and That’s a Good Thing)
Have you ever been in situation when you need quick insight generation but due to lack of resources and information you lost large amount of revenue? We live in data world, not only data but Big Data. Datasets are being generated in very large volume, variety and very high speed. Just forget about handling this type of data with your Traditional BI system. Due to scarcity of resources these traditional systems are sometimes incapable of generating the required insights. They fail in collecting the data, preparing it, or simply in understanding it. There are multiple sources of data like Amazon, Facebook, Twitter and they blend this data with your preferences and recommend new data and offers products to you.
Now, You as a Regional Sales Manager wants to unfold the insights hidden in your data. Exploring this data is a big task with quite a large number of steps. But isn’t it difficult to find the solution for your continuously changing data requirements also. In this write-up, we will look into traditional BI, the state of present industry and how Augmented Analytics is helpful in future BI.
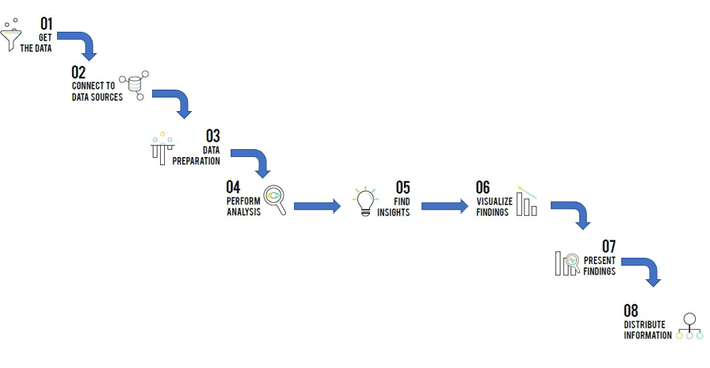
Shown below is the traditional BI and Analytics flow. Each and every step will be changed drastically by Augmented Analytics.
What is Augmented Analytics?
Before going further, It is good to discuss about the real meaning of “augmented analytics”. As per Gartner, in their October 2018 research “Augmented Analytics Is the Future of Data and Analytics”. On Medium, Bill Su clearly says that augmented analytics “[automates] insight generation… through the use of advanced machine learning and artificial intelligence algorithms.”
Everything about Analytics and Business Intelligence process will be changed by the Artificial Intelligence provided by Augmented Analytics. It will help in simplifying, removing certain steps and change/improve others.
What is new in Business Intelligence: Augmented Analytics
Augmented Analytics automates the data insight with the help of Machine Learning and Artificial Intelligence. Most important role is played by Natural Language Processing so as to automate the data preparation. Users can get the real insight and take action on data quickly and accurately.
Why is it at all important to your organization?
Being a Regional Sales Manager, you came to know that your revenue is decreasing 20% from last month. But what does that really mean to you?
- A decline in industry trend?
- Is this because one of your AD channels is not working?
- Or it is because of some other reason?
That’s where you need to go deeper into web analytics, ecommerce and social media data to uncover what resulted in decline of your revenue. Suppose you end up realizing that it is due to less effective social ads. So you hired new agency. Now this insight is actionable because it connects directly to your action.
How ??
There can be some solution that will relieve company’s dependence on data scientists by doing insight generation automatically through the use of AI and ML algorithms. An Augmented Analytics engine can automatically go through company’s data , clean it, analyze it and convert the insights into the action steps for the business owners. It will have either little or no technical supervision.
The goal here is to make analytics tools as easy as search interface, it will behave like a conversation with virtual assistant.
User Interface: User can speak a query after clicking start button. The voice is converted into Text and a resultant Bar graph is shown below.
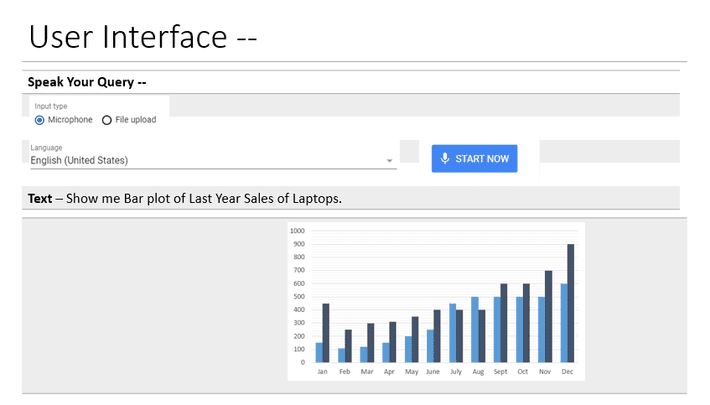
Speech is used to identify data and prepare it. The data is validated using speech to find whether the data is useful or not using some standard statistical tests. User can visualize the Report/chart using speech to enable the decision quickly.
This application will:
Use Speech to identify data and prepare it.
Use Speech to validate whether it would be useful by using standard statistical tests.
Use Speech to determine kind of report/chart on top of this to further visualize it to enable decision.
Contextual View:
It has three parts of implementation:
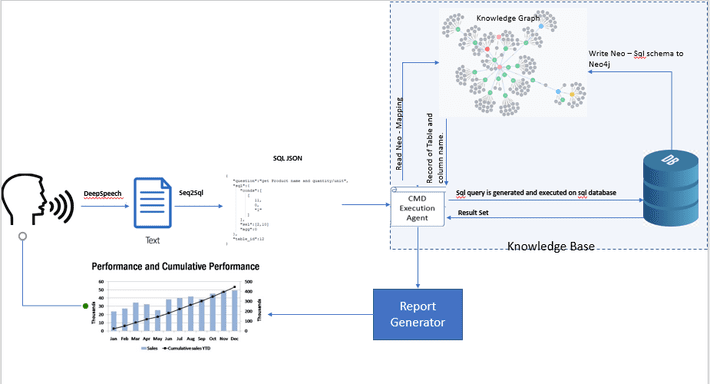
- Knowledge Base Creation, SQL generation.
- Natural Language Processing (TextToSQL) ,Speech to Text conversion.
- Generate Reports/Charts from SQL created in Part 1.
Below class creates the Knowledge Graph in Neo4J db from Mysql DB.
WriteNeo.java
- Connect to Sql database.
- getColumnsMetaData and create JSON.
- Connect to Neo4J
- Call apoc.convert.fromJsonMap and pass Json. It will create Nodes and Child in graph Db of Neo4j.
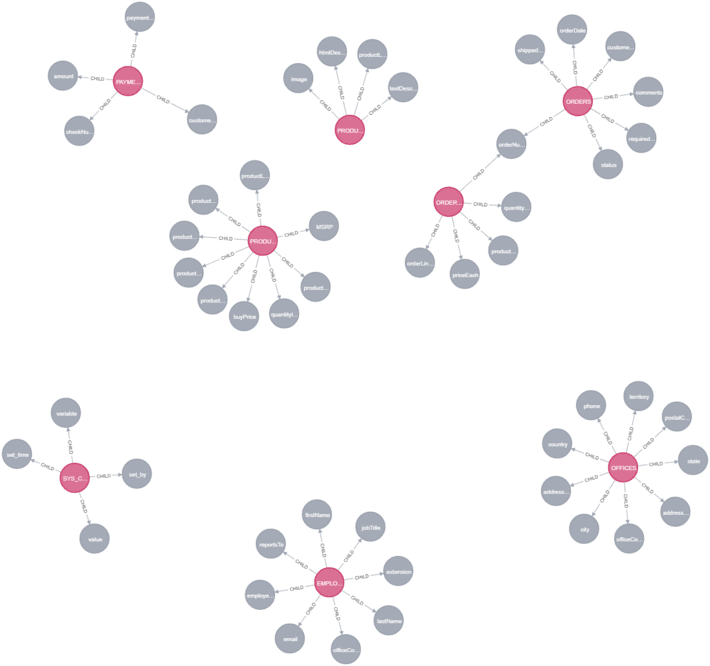
Figure — Neo4J graph of Mysql Schema.
Assuming that we have the Seq2Sql ready with output in the form of Json:
{ “question”:”Display the Yearly Sale”, “sql”:{ “conds”:[ [ 0, 0, 0 ] ], “sel”:[2,1], “agg”:[1,0],
“func”:[2,1] }, “table_id”:4 }
The fields represent the following:
question: the natural language question written by the worker.
table_id: the ID of the table to which this question is addressed.
sql: the SQL query corresponding to the question. This has the following subfields:
sel: the numerical index of the column that is being selected. You can find the actual column from the table.
agg: the numerical index of the aggregation operator that is being used. E.g. Group by
func: the numerical index of the aggregation operator that is being used. E.g. date(), month(), year()
conds: a list of triplets (column_index, operator_index, condition) where:
column_index: the numerical index of the condition column that is being used. You can find the actual column from the table.
operator_index: the numerical index of the condition operator that is being used. Eg. >,<,= condition: the comparison value for the condition, in either string or float type.
Another class ReadNeo.java
- Read above json to fetch the table_id, Condition columns, selection columns etc.
- Each node in neo4j has its label index. E.g Product table node has tabInd = 12. So it is mapped to fetch the table name from neo4j. Further graph is traversed to get the column names.
- The above sql(with tableid and columned ) is converted to actual sql query that can be executed.
Conclusion
The world has changed completely: data has now become big data. New digital records are getting generated every second by uncountable devices and users. This data is persisted and processed in extremely complex ways. To make sense out of it more strong and firm analytical systems are required.
Every organization, be it government or private will depend on augmented analytics to understand the relationship between the multiple data sources with huge volume of data. Finally, augmented analytics will change the way how users experience analytics and BI.