
1. Background
New home construction plays a significant role in housing economy, while simultaneously impacting other sectors such as timber, furniture and home appliances. New house sales is also an important indicator of country’s overall economic health and direction. In the last 50 years there has been few significant bumps and turning points in this sector that shaped the trajectory of the overall economy. Here I review the historical patterns and make a short-term (5 years) projection of new home sales.
2. Data & methods
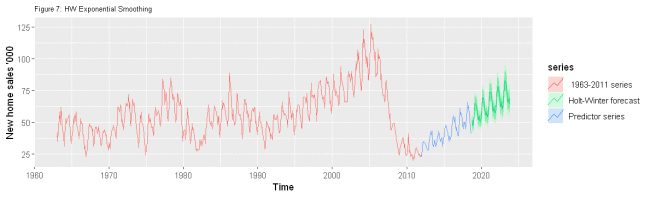
Census Bureau (census.gov) is the source of the dataset for this analysis (side note: it’s a great source for social, economic and business time series datasets). This is a non-seasonally adjusted monthly sales report. I did the analysis in R. Although Python has great ts resources, but for forecasting it is not even close to R, thanks to the great forecast package developed by Rob J Hyndman (which I often refer to a one-stop shop for all forecasting problems). The decomposed time series data shows a predictable seasonality and a trend component. A Holt Winter Exponential Smoothing should work just fine for data of this kind and shape. Nevertheless, I’m using 3 different methods to compare: ETS, HW and ARIMA. There are plenty of resources on the internet on each of these forecasting methods, so I’m not going to discuss them in here (and there is another good reason for not discussing theories too much!).
3. Key results
- New home sales was steady for a long period of time, with no growth for 30 years since 1960s. Then sales picked up in the beginning of ‘90s and kept growing steadily for about 15 years until 2005.
- New home sales started to decline in 2005, and in just 5 years declined by 75%.
- Sales is recovering since 2012; but far from catching up with the pre-crash sales yet
- Current sales is about 630k new homes per year
- 5-year projection until 2023 in a business-as-usual scenario shows total home sales at 870k – a total growth of about 40% (7% per year).
- The projected growth is not even close to pre-2005 level (>1200k/year). With the current trend it can be around 2035 to catch up to 2005 level
- There seems to be a 5-10 years cycles in the historical trend. If this holds, we may see some de-growth in the near future
4. Discussion
As revealed in the report that came out recently, and also reported in Wall Street Journal, seasonally adjusted rate of new home sales has declined by 8.9% in October of 2018, signaling a market slowdown. Some market analysts expect this to continue, predicting post-2012 boom may be over. It will take a couple of years to understand the trend before we can say with higher certainty what the future holds for this important economic sector.
[The R codes & further analysis on this topic here. Follow me on Twitter for updates on new analysis.]